
2009
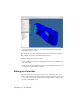


Table Of Contents
- Contents
- Stress Analysis
- 1 Get Started With Stress Analysis
- 2 Analyze Models
- 3 View Results
- 4 Revise Models and Stress Analyses
- 5 Generate Reports
- 6 Manage Stress Analysis Files
- Simulation
- Index

Edit the color bar
1 Click Color Bar on the Stress Analysis panel bar.
By default, the maximum and minimum values shown on the color bar
are the maximum and minimum result values from the solution. You
can edit the extreme maximum and minimum values, and the values at
the edges of the bands.
2 To edit the maximum and minimum critical threshold values, click the
Automatic check box to clear the selection, and then edit the values in
the text box. Click Apply to complete the change.
To restore the default maximum and minimum critical threshold values,
select Automatic, and then click Apply.
The levels are initially divided into seven equivalent sections, with default
colors assigned to each section. You can select the number of contour
colors in the range of 1 to 12.
3 To increase or decrease the number of colors, click the Increase
Colors and Decrease Colors buttons. You can also enter the number of
colors you want in the text box.
4 Click the Invert Colors check box to reverse the sequence of colors
displayed in the color bar.
5 You can view the result contours in different colors or in shades
of gray. To view result contours on the grayscale, click Grayscale under
Color.
NOTE It does not work for safety factor.
6 By default, the color bar is positioned in the upper-left corner. Select an
appropriate option under Position to place the color bar at a different
location.
7 Under Size, select an appropriate option to resize the color bar, and then
click Apply.
The color bar preferences such as color, position, and size are applied to
all of the result types.
The Maximum and Minimum threshold values, number of colors and
Invert colors preferences are applied only to the selected result type.
Editing the Color Bar | 27