
2009
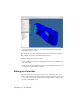


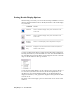

Table Of Contents
- Contents
- Stress Analysis
- 1 Get Started With Stress Analysis
- 2 Analyze Models
- 3 View Results
- 4 Revise Models and Stress Analyses
- 5 Generate Reports
- 6 Manage Stress Analysis Files
- Simulation
- Index
View Results
After analyzing your model under the stress analysis conditions that you defined, you can
visually observe the results of the solution.
This chapter describes the how to interpret the visual results of your stress analyses.
Using Results Visualization
Use results visualization to see how your part responds to the loads and
constraints you apply to it. You can visualize the magnitude of the stresses that
occur throughout the part, the deformation of the part, and the stress safety
factor. For modal analysis, you can visualize the resonant frequency modes.
Enter results visualization
1 Start in the stress analysis environment. Open a part or sheet metal part
that was analyzed previously, or complete the required steps in your current
analysis.
2 On the standard toolbar, click the Stress Analysis Update tool.
The color bar displays in the graphics window.
Post-processing commands are enabled on the standard toolbar, and the display
mode shifts to stepped contours.
3
25