
2009
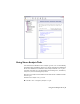
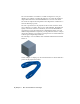

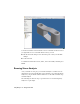
Table Of Contents
- Contents
- Stress Analysis
- 1 Get Started With Stress Analysis
- 2 Analyze Models
- 3 View Results
- 4 Revise Models and Stress Analyses
- 5 Generate Reports
- 6 Manage Stress Analysis Files
- Simulation
- Index

Here, the same part is broken into small blocks (meshed into elements), each
with well-defined behaviors capable of being summed (solved) and easily
interpreted (post-processed). For sheet metal, a special element type is used.
It is assumed that the model is thin in one direction relative to the size of the
other dimensions. The model has identical topologies on the top and bottom
and has only one topology through the thickness of the model.
Interpreting Results of Stress Analysis
The output of a mathematical solver is generally a substantial quantity of raw
data. This quantity of raw data would normally be difficult and tedious to
interpret without the data sorting and graphical representation traditionally
referred to as post-processing. Post-processing is used to create graphical
displays that show the distribution of stresses, deformations, and other aspects
of the model. Interpretation of these post-processed results is the key to
identifying:
■ Areas of potential concern as in weak areas in a model.
■ Areas of material waste as in areas of the model bearing little or no load.
■ Valuable information about other model performance characteristics, such
as vibration, that otherwise would not be known until a physical model
is built and tested (prototyped).
The results interpretation phase is where the most critical thinking must take
place. You compare the results (such as the numbers versus color contours,
movements) with what is expected. You determine if the results make sense,
and explain the results based on engineering principles. If the results are other
Interpreting Results of Stress Analysis | 9