
Technical data

Using the TR-55 Tabular Hydrograph Method to Calculate Runoff
51
To calculate the peak discharge using the TR-55 Tabular Hydrograph
Method (continued)
Steps
Use
to look up
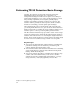
11 Specify the 24-hour rainfall amount for
subarea #1.
Type a value for the 24-hour rainfall, or click
Rainfall to display the Define Rainfall Frequency
dialog box. You can use this dialog box to select
the 24-hour rainfall amount for a specified county
and storm frequency
(1, 2, 5, 10, 25, 50, 100).
Select the Rainfall
Frequency for a County
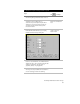
12 Specify the runoff curve number for subarea #1.
Type in a value for the runoff curve number that
represents the hydrological character of your
subarea, or you can click RCN to display the
Runoff Curve Number editor. The Runoff Curve
Number editor lists runoff curve numbers based
on soil type and surface cover. These values are
from Table 2-2 in the TR-55 manual.
Select and Edit the Runoff
Curve Numbers for
Different Soil Groups and
Cover Types
13 Specify the hydrologic data for the remaining
subareas.
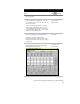
14 Click Compute to calculate the Peak Discharge
and Peak Time values.
You can click Graph to create a hydrograph from
the current data.
Normally, you would compile the pre-
development TR-55 Tabular Hydrograph Method
data for your project site using the above steps,
and then repeat the above steps modifying the
hydrological values for the site as required to
compile the post-development TR-55 Tabular
Hydrograph Method data.
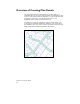
Overview of Outputting
Hydrology Data
15 Compare the pre- and post-development TR-55
Tabular Hydrograph Method data to assess the
impact of site development on the watershed.