
Technical data

Using the TR-55 Graphical Peak Discharge Method to Calculate Runoff
47
To calculate the peak discharge using the TR- 55 Graphical Peak
Discharge Method (continued)
Steps
Use
to look up
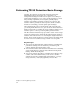
5 Specify the watershed area.
You can type a value for the area in the edit
box, or, if you created a watershed with the
Terrain Explorer, you can select the polyline from
your drawing by clicking Select and selecting
the polyline. You can also draw a new polyline
for selection.
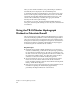
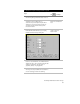
6 Specify the runoff curve number.
You can type in a value for the runoff curve
number that represents the hydrological character
of your site. You can also click Select to display the
Runoff Curve Number Editor dialog box which lists
runoff curve numbers based on soil type and
surface cover. These values are from Table 2-2 of
the TR-55 publication.
Specify a Runoff
Curve Number
7 Specify the time of concentration value.
You can type in a value for the time of
concentration, or click Select to display the Time
of Concentration Calculator.
Use this calculator to specify the sheet flow,
shallow flow, and channel flow parameters, and
compile the time of concentration data.
Calculate the Watershed
Time of Concentration
8 Specify the pond and swamp areas
adjustment factor.
You can type a value for the pond and swamp
areas adjustment factor, or click Select, and select
one or more closed polyline(s) from your drawing
that represent the ponds and swamps in the
watershed area.
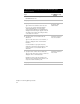
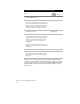
9 Specify the 24-hour rainfall amount.
You can type a value for the 24-hour rainfall
amount, or click Select to display the Define
Rainfall Frequency dialog box. Use this dialog box
to select the 24-hour rainfall amount for a
specified county and storm frequency (1, 2, 5, 10,
25, 50, or 100 years).
Use the Rainfall
Frequency Editor to View,
Edit, and Define Rainfall
Frequency