Copyright © 1999 Autodesk, Inc. All Rights Reserved This publication, or parts thereof, may not be reproduced in any form, by any method, for any purpose. AUTODESK, INC. MAKES NO WARRANTY, EITHER EXPRESSED OR IMPLIED, INCLUDING BUT NOT LIMITED TO ANY IMPLIED WARRANTIES OF MERCHANTABILITY OR FITNESS FOR A PARTICULAR PURPOSE, REGARDING THESE MATERIALS AND MAKES SUCH MATERIALS AVAILABLE SOLELY ON AN “AS IS” BASIS. IN NO EVENT SHALL AUTODESK, INC.
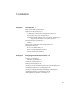
Contents Chapter 1 Introduction 1 What Is Autodesk Civil Design? 2 Sample Civil Design Projects 2 Completing a Transportation Engineering Project 3 Developing a Proposed Grading Plan 4 Analyzing Existing Surface Water Conditions and Design of Proposed Storm Water Conveyance System 5 Starting Autodesk Civil Design 6 Menus 7 What’s New in Autodesk Civil Design Release 2 8 Finding Information 9 How to Use Online Help 10 How to Use the Online Tutorial 14 Exiting Autodesk Programs 14 Chapter 2 Designing Fini
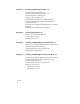
Chapter 3 Performing Hydrologic Studies 33 Overview of Hydrologic Studies 34 Gathering Data for Hydrologic Analysis 35 Using the Hydrology Calculators 36 Using the Culvert Calculator 38 Using the Rational Method to Calculate Runoff 41 Using the TR-55 Graphical Peak Discharge Method to Calculate Runoff 45 Using the TR-55 Tabular Hydrograph Method to Calculate Runoff 48 Estimating TR-55 Detention Basin Storage 52 Chapter 4 Creating Plan Details 55 Overview of Creating Plan Details 56 Creating Intersections
Transitioning a Roadway 79 Modifying Roadway Slope 81 Superelevating a Roadway 83 Using Roadway Data for Finished Ground Surfaces 86 Chapter 7 Designing Pipe Runs 89 Overview of Designing Pipe Runs 90 Drawing and Defining Pipe Runs 91 Importing Plan View Pipe Runs 94 Drafting Conceptual Profile Pipe Runs 95 Editing Pipe Runs Graphically 96 Working with the Pipes Run Editor 98 Drafting Finished Plan Pipe Runs 99 Drafting Finished Profile Pipe Runs 101 Chapter 8 Plotting Drawings 103 Overview of Plotting
1 Introduction In this chapter ■ Use Autodesk Civil Design with AutoCAD Land Development Desktop to complete site grading plans, hydrologic analysis, and roadway design.
What Is Autodesk Civil Design? Autodesk Civil Design Release 2 is part of the Land Development Solutions II suite of products. Autodesk Civil Design Release 2 requires AutoCAD Land Development Desktop Release 2, and uses all the project data created in AutoCAD Land Development Desktop, including points, terrain models, alignments, and so on. The programs work seamlessly together. You never need to change programs when you need to access a command; you just change menus using the Menu Palette Manager.
Completing a Transportation Engineering Project Autodesk Civil Design features powerful tools for completing all type and scale transportation (road, rail, runway, channel, and so on) projects. These projects are generally alignment based. For example, a proposed centerline is designed as a base alignment. From that alignment, profiles and sections can be extracted and referenced in the design of the vertical details of the project.
Developing a Proposed Grading Plan Autodesk Civil Design offers a broad set of tools to assist you in the design of a proposed grading plan. In some cases, the capabilities work in a way that is very similar to manual methods that you may have used in the past. Other options are highly automated, offering visual and engineering results instantly as you fine tune your design. Each grading plan will present different challenges.
Analyzing Existing Surface Water Conditions and Design of Proposed Storm Water Conveyance System Autodesk Civil Design provides capabilities to analyze existing surface water conditions across a site, and then layout and analyze a proposed storm water collection system (pipes, structures, ponds). Key to this solution is the integration with the terrain modeling and the graphical layout and editing capabilities of AutoCAD Land Development Desktop.
Starting Autodesk Civil Design Autodesk Civil Design runs within the AutoCAD Land Development Desktop. When you install Autodesk Civil Design, all of your AutoCAD Land Development Desktop commands continue to function as they did before. To start Autodesk Civil Design after installing it, select the AutoCAD Land Development Desktop R2 icon in the AutoCAD Land Development Desktop R2 program group.
Menus Autodesk Civil Design adds the following menus to AutoCAD Land Development Desktop: Pull-down menus included in Autodesk Civil Design Menu Functionality Grading Perform site grading using grading objects, points, and daylighting; create grading plans for detention ponds Layout Create intersections, cul-de-sacs, parking stalls, and sports fields Profiles Create existing ground and finished ground profiles Cross Sections Create existing ground and finished ground sections Hydrology Perform hy
What’s New in Autodesk Civil Design Release 2 The following topics describe the new features in Release 2 of Autodesk Civil Design.
Changes to Pipes ■ ■ Run Editor Settings now includes option to turn off Automatic Pipe Resizing Haestad Data Transfer: Haestad SewerCAD and StormCAD products can read and save in the Civil Design pipes.mdb format Finding Information The documentation set for Autodesk Civil Design R2 is a combination of online Help files and printed documentation. The following documents are included in your Autodesk Civil Design documentation set.
Some sections in this guide have numbered steps you can perform to complete a task, such as creating a grading plan. The relevant help topic is listed to the right of each step. For example: To create a grading object Steps Use 1 From the Grading menu, choose Slope Grading ➤ Grading Wizard. Create a Grading Object using the Grading Wizard to look up How to Use Online Help You can access help files for Autodesk Civil Design by using the following methods.
When you open a Help file from either the Help menu or the Help icon, the Help Topics window is displayed, as shown in the following illustration. This window has three tabs: Contents, Index, and Find. ■ ■ ■ Click the Contents tab to view the Table of Contents. This tab has books with topic pages listed underneath each book. To view a topic, double-click the page, or select the page and click Display.
The following illustration shows a typical help topic. When you view a Help topic, you can use the menus and buttons to control options and to navigate. You can also access a shortcut menu by right-clicking in the Help window. Key Concepts ■ When a topic is open, you can move to other relevant topics or definitions by selecting the green, underlined text. ■ You can click viewed. ■ You can click to return to the Help Topics window.
The following task shows you how to locate a topic title in the Help file. To use the online Help to locate a topic title Steps 1 Start Help by using one of the methods listed in the Accessing Help Files list in “How to Use Online Help” in this chapter. 2 Click . The Help window appears as shown in the following illustration. NOTE If you have not previously used the Find tab, then the Find Setup Wizard prompts you to create a word search database. Click Next to proceed through the wizard.
To use the online Help to locate a topic title (continued) Steps 4 Click the name of the topic that you want to read, and then click Display to view the Help topic. 5 You can print the topic by selecting Print; you can view relevant topics by clicking the green, underlined text; or you can return to the Find tab by clicking Help Topics. How to Use the Online Tutorial AutoCAD Civil Design R2 has an online tutorial that you can use to learn the program’s concepts.
2 Designing Finished Ground Sites In this chapter ■ Grading Overview ■ Creating a Grading Object ■ Editing a Grading Object ■ Creating Contours and Surface Data from a Grading Object ■ Calculating Volumes for a Grading Object ■ Creating a Grading Plan using Daylighting Commands ■ Grading the Surface for a Detention Pond ■ Adding Landscape Symbols to Drawings Use the commands on the Grading menu to create grading objects, to calculate daylighting information, and to create and shape detention
Overview of Grading Developing a grading plan typically results in the creation of a proposed surface model. This allows you to analyze a site efficiently and accurately and to create reports, graphics, and 3D presentation materials that are necessary for the completion of the project.
Creating a Grading Object Grading objects are three-dimensional objects that represent finished ground grading schemes. You can create a grading object by drawing a footprint, defining slopes, and defining the grading targets (which are the elevations, distances, or a surface that you want to grade to) to generate the 3D information. After you’ve generated a grading object, you can create contours, breaklines, and surfaces from the 3D information.
To create a grading object using the Grading Wizard Steps Use 1 From the Grading menu, choose Slope Grading ➤ Grading Wizard. Use the Next and Back buttons to move through the sheets. Create a Grading Object using the Grading Wizard 2 On the Footprint sheet, enter a Grading Scheme Name and Description for the footprint. Select Inside or Outside (or Right or Left if the footprint is open) for the direction you want to grade from the footprint.
To create a grading object using the Grading Wizard (continued) Steps Use 5 On the Corners sheet, choose a global corner treatment, or enter corner treatments for individual corners. Configure the Grading Corners Settings 6 On the Accuracy sheet, select a method for spacing, and enter increment values for the projection lines.
Editing a Grading Object If you want to make changes to the grading object after you have created it, you can change the Grading Properties, or use grips to graphically edit the grading object. Using the grading object shortcut menu is another way you can make changes to the vertices, slope tags, and target regions. To edit a grading object it must be unlocked. You can also make changes to a grading object using AutoCAD editing commands, including grip editing.
To edit a grading object’s properties Steps Use to look up 1 Select a grading object in your drawing, then rightclick to access the grading object shortcut menu. 2 Click on Grading Properties. 3 Modify the properties as needed. When you exit the Grading Properties dialog box, the grading object is updated with the changes. Overview of Configuring the Grading Settings To grip edit a grading object Steps Use 1 Select a grading object in your drawing.
To edit a grading object using the shortcut menu Steps Use 1 Select a grading object in your drawing. Overview of Editing a Grading Object using the Shortcut Menu to look up 2 Right-click to display the grading object shortcut menu. For more information about editing grading objects, use up “Overview of Editing Grading Objects” in the online Help.
Creating Contours and Surface Data from a Grading Object If you want to use the grading object’s 3D information in a terrain model surface, you have several options. You can create a new surface from the grading object, you can create contours, or you can create breakline data from the grading object for any new or existing surface. Surfaces are created using 3D information from the grading object footprint, daylight lines, and projection lines. The footprint and projection lines are treated as breaklines.
To create a surface from a grading object (continued) Steps Use to look up Use to look up 4 To view the surface details, use the Terrain Model Explorer. From the Terrain menu, choose Terrain Model Explorer. 5 In the left pane of the Terrain Model Explorer, open the folder of the surface you created from the grading object to see the surface details. To create contours from a grading object Steps 1 Create a grading object. For more information, see “Creating a Grading Object” in this chapter.
To create breaklines from a grading object Steps Use to look up 1 Create a grading object. For more information, see “Creating a Grading Object” in this chapter. 2 From the Grading menu, choose Slope Grading ➤ Create Breaklines. Create Breaklines from a Grading Object 3 Do one of the following: Type Current to add breaklines to the current surface. Select the grading object and enter a description for the breaklines. Type New to add the breaklines to a new surface.
Key Concepts ■ Volumes are only calculated under the following conditions: ■ ■ ■ Volumes are not calculated under the following conditions: ■ ■ ■ ■ ■ ■ If the target is a surface and the grading direction is to the outside of a closed footprint, volumes will be calculated between the object and the surface If the target is an absolute elevation, volumes will be calculated between the object and the elevation If the grading object has multiple targets If the grading object has a single relative eleva
Creating a Grading Plan using Daylighting Commands As an alternative to using the grading object to create grading plans, you can use the Daylighting commands. The following example explains how to use these commands to draw the outline of a building pad and then project slopes down to match the existing ground. Key Concepts ■ ■ ■ An existing ground surface model is required for using the Daylighting commands. You can use either lightweight, 2D, or 3D polylines to draw the footprint outline.
To create grading plans using daylighting commands (continued) Steps Use 5 From the Grading menu, choose Daylighting ➤ Create Single to determine the daylight matchline at a specified slope. Single applies a constant slope to the entire polyline footprint. Calculate Daylight Points Based on a Single Slope to look up The command automatically checks for both cut and fill. As the command runs, temporary objects are drawn that represent the location where the projected slope matches into existing ground.
Grading the Surface for a Detention Pond You can use the detention pond design features of Autodesk Civil Design to design retention and/or detention ponds for controlling peak flow rate amounts from watersheds. Before you begin the grading plan for the detention pond, determine the design criteria for the pond, such as the volume of water that the pond has to store. To do this you can use the Autodesk Civil Design Hydrology commands.
To design a detention pond (continued) Steps Use 4 From the Grading menu, choose Pond Slopes ➤ Draw Slope Template to draw the pond slope template polyline. Draw a Pond Slope Template to look up There are several ways to shape the pond. One method is to use a pond slope template, as shown below. The pond slope template is essentially a cross section view of the pond perimeter. You draw the pond slope template at a 1:1 scale, and then you can apply it to the pond perimeter.
Adding Landscape Symbols to Drawings To put the finishing touches on your finished ground site, you can add symbols to depict various sports fields, patios and walks, and parking lots. The following illustration is an example of a basketball court symbol. Key Concepts ■ ■ ■ ■ You can move, scale, and rotate the symbols after you insert them using the grip editing commands. You can insert walkways and patios with various paving styles and hatch patterns.
3 Performing Hydrologic Studies In this chapter Autodesk Civil Design provides a variety of methods you can use to calculate runoff from a site, perform ■ Overview of Hydrologic Studies ■ Gathering Data for Hydrologic Analysis ■ Using the Hydrology Calculators ■ Using the Culvert Calculator ■ Using the Rational Method to Calculate Runoff ■ Using the TR-55 Graphical Peak Discharge Method to Calculate Runoff ■ Using the TR-55 Tabular Hydrograph Method to Calculate Runoff ■ Estimating TR-55 De
Overview of Hydrologic Studies Early in the process of evaluating a site, you must evaluate how your proposed development will affect watershed runoff. In general, most urban and rural developments alter the hydrological character of a site by reducing the pervious surface area, which ultimately decreases infiltration and travel times.
Gathering Data for Hydrologic Analysis When evaluating a site to determine whether development is feasible, you must consider what effect the development of the site will have on the area’s runoff amounts. The first step in this process is to gather hydrological data about the site, primarily for the pre-development model. You must have an existing ground surface, and you must know the soil type and current land use of the site.
To add watershed and drainage data to your drawing Steps Use 1 Create an existing ground surface for the proposed site. Overview of Creating Surfaces 2 Generate watershed data for the existing ground surface model. Create a Watershed Model After Building the Surface to look up 3 From the Terrain menu, choose Surface Display ➤ Slope Arrows to draw arrows that follow the slope of the existing surface. 4 From the Terrain menu, choose Surface Utilities ➤ Water Drop to draw flow paths.
The following illustration shows a Manning’s n gravity pipe calculator. To solve for the flowrate, you enter values in the Slope, Manning’s n, Depth of Flow, and Diameter boxes. You can enter values as mathematical equations. For example, if the required diameter is 36 inches and the required flow percentage in a particular channel is 75%, then enter 36*0.75, and the value 27.0 is displayed.
Using the Culvert Calculator Autodesk Civil Design has several features that you can use to design storm water conveyance facilities for controlling the runoff on a site. For example, you can design outlet and inlet structures including channels, culverts, weirs, risers, gravity pipes, orifices, and so on. This section describes how to use the Culvert Calculator to design a culvert. A culvert can be used to channel peak flow amounts under roadways and other structures.
To design a culvert (continued) Steps Use 4 From the Hydrology menu, choose Culvert Calculator to display the Culvert Design dialog box. Calculate Culvert Size and Shape to look up 5 Select the applicable barrel shape from the list. You can select circular or box for the shape of the barrel. 6 Specify the tailwater length. Specify the Tailwater Length You can type a value for the tailwater, or you can click Select to display the Tailwater Editor dialog box.
To design a culvert (continued) Steps Use 8 Specify the flow rate for the culvert. Specify the Flowrate for a Culvert to look up You can type a value directly, or you can calculate a flow rate value by clicking Select to display the Runoff Editor dialog box. From here, you can display the Runoff Method Selection dialog box to select an appropriate runoff method where you can then either import or calculate the flow. 9 Specify the Manning’s n roughness coefficient value for the culvert.
To design a culvert (continued) Steps Use to look up 12 Click OK to close the Culvert Settings dialog box and return to the Culvert Calculator. 13 Click Over-Top to access the Culvert Weir Editor dialog box to check the overtop conditions of the culvert. Change the Overtop Flow Values to Use in the Culvert Calculations 14 Verify that the culvert design meets all of the relevant design criteria and conditions. 15 Create a Performance Curve graph for the designed culvert by clicking P-Curve.
Key Concepts ■ ■ ■ ■ Establish an intensity duration frequency (IDF) curve file (.idf extension) for your project location. Determine the size of the drainage area (A), the runoff coefficient (C), the adjustment factor, the time of concentration (Tc), the rainfall frequency, and the rainfall intensity. This can all be calculated or selected using commands from the Hydrology menu. Slopes and elevations across a site can be extracted from a surface model.
To calculate the peak discharge using the Rational Method (continued) Steps Use 2 From the Hydrology menu, choose Settings to display the Hydrology Tools Settings dialog box. Change the Hydrology Unit Settings to look up 3 Click the Units button to specify the measurement units. Click Precision to specify the required precision settings for your units. 4 From the Hydrology menu, choose Runoff ➤ Rational to display the Rational Method dialog box.
To calculate the peak discharge using the Rational Method (continued) Steps Use 8 Specify the runoff coefficient. Specify the Rational Runoff Coefficient to look up You can type in a value for the runoff coefficient that represents the ratio of runoff to rainfall, or click Coef to select a single value from a list of standard runoff coefficients. You can also click CmpCoef to calculate a composite runoff coefficient value, if applicable, for your site. 9 Select an adjustment factor.
Using the TR-55 Graphical Peak Discharge Method to Calculate Runoff Technical Release 55 (TR-55), prepared by the Soil Conservation Service (SCS), presents two simplified methods for estimating storm water runoff from urbanizing watersheds. Although the procedures found in TR-55 are particularly well suited to urban and urbanizing watersheds, the methods can be applied, in general, to any small watershed when the governing limitations of either method have been adequately addressed.
To calculate the peak discharge using the TR- 55 Graphical Peak Discharge Method Steps Use to look up 1 Determine the specific watershed characteristics and design criteria, including soil and vegetation types, rainfall frequency and distribution, and sheet, shallow, and channel flow parameters.
To calculate the peak discharge using the TR- 55 Graphical Peak Discharge Method (continued) Steps Use to look up 5 Specify the watershed area. You can type a value for the area in the edit box, or, if you created a watershed with the Terrain Explorer, you can select the polyline from your drawing by clicking Select and selecting the polyline. You can also draw a new polyline for selection. 6 Specify the runoff curve number.
After you enter all the information, the peak discharge is calculated automatically and is displayed in the Peak Discharge line. To determine the runoff peak discharge for other storm events, select the new storm frequency using the Select button next to the rainfall edit field in the Graphical Peak Discharge Method dialog box,. The software will automatically re-calculate the appropriate rainfall intensity and the runoff peak discharge.
To calculate the peak discharge using the TR-55 Tabular Hydrograph Method Steps Use to look up 1 Determine the rainfall distribution type for the specific watershed. 2 For each subarea, determine the subarea’s hydrologic parameters, including the area, time of concentration, travel time, 24-hour rainfall, and runoff curve number.
To calculate the peak discharge using the TR-55 Tabular Hydrograph Method (continued) Steps Use to look up 5 Select the rainfall distribution type from the Rainfall Distribution list. 6 Specify the subarea name. 7 Specify the area of subarea #1. Type a value for the subarea’s area in the edit box, or, if you created a watershed with the Terrain Model Explorer, select the polyline representing the subarea from your drawing by clicking Area and selecting the polyline.
To calculate the peak discharge using the TR-55 Tabular Hydrograph Method (continued) Steps Use 11 Specify the 24-hour rainfall amount for subarea #1. Select the Rainfall Frequency for a County to look up Type a value for the 24-hour rainfall, or click Rainfall to display the Define Rainfall Frequency dialog box. You can use this dialog box to select the 24-hour rainfall amount for a specified county and storm frequency (1, 2, 5, 10, 25, 50, 100). 12 Specify the runoff curve number for subarea #1.
Estimating TR-55 Detention Basin Storage Typically, most agencies, charged with reviewing storm water management plans for developing sites, require that postdevelopment discharges from the site are equal to or less than predevelopment discharges for one or more storm frequencies. To meet this governing requirement, most designers generally employ detention type facilities in strategic locations across the site.
To calculate the required storage volume for ponds Steps Use to look up 1 Determine the pre- and post-development watershed hydrological characteristics of the site. 2 Use one of the Hydrology runoff methods described in the preceding topics to determine the post-development peak inflow discharge to the detention basin and the predevelopment peak outflow discharge from the detention basin.
To calculate the required storage volume for ponds (continued) Steps Use to look up 6 Select the applicable rainfall distribution from the Rainfall Distribution list. 7 Specify the drainage area. Specify the Drainage Area Type a value for the area in the edit box, or, if you created a watershed with the Terrain Model Explorer, select the polyline from your drawing by clicking Select and selecting the polyline. You can also draw a new polyline for selection.
4 Creating Plan Details In this chapter ■ Overview of Creating Plan Details ■ Creating Intersections ■ Creating Cul-de-Sacs You can use the Layout commands to design cul-de-sacs and intersections for plan alignments.
Overview of Creating Plan Details The AutoCAD Land Development Desktop contains a full set of commands that you can use to draw and define road alignments. After you have created and defined an alignment, you can use the Autodesk Civil Design commands to add the finishing touches to the alignment, such as cul-de-sacs and intersections. For example, to create the subdivision design as shown below, you could offset the centerline alignments, and then create cul-de-sacs at the alignment ends.
Creating Intersections You can use the Autodesk Civil Design intersection commands to easily clean up lines where road alignments cross. The intersection commands automate the process of intersection creation, breaking lines where necessary, and filleting curves. The following illustration shows the intersection of two tangents. Key Concepts ■ ■ ■ Use continuous line types when you are designing alignments that will meet in intersections.
To design intersections Steps Use 1 Draw the roadway centerline alignments for the intersection by selecting commands from the AutoCAD Land Development Desktop Lines/Curves menu. Overview of Lines and Curves to look up Or, draw the roadway centerlines using polylines. 2 If you drew the alignments with lines and curves, from the Alignments menu, choose Define From Objects to define the roadway alignments.
Creating Cul-de-Sacs Autodesk Civil Design has a set of commands that you can use to design five different types of cul-de-sacs: tangent, curved, hammerhead, elbow, and teardrop. The following illustration shows a cul-de-sac drawn off a curved roadway. Key Concepts ■ ■ ■ You should use continuous line types when you are adding a culde-sac to an alignment. All cul-de-sac commands treat a single offset as the outer offset.
To design cul-de-sacs Steps Use 1 Draw the roadway centerline alignments for the cul-de-sacs by selecting commands from the AutoCAD Land Development Desktop Lines/Curves menu. Overview of Lines and Curves. to look up Or, you can draw the roadway centerlines using polylines. 2 If you drew the alignments with lines and curves, then from the Alignments menu, choose Define From Objects to define the roadway alignments.
5 Viewing and Editing Roads in Profile View In this chapter If you have a plan alignment and an existing ■ Overview of Viewing and Editing Roads in Profile View ■ Creating Existing Ground Profiles ■ Creating Finished Ground Road Profiles ■ Editing Vertical Alignments ground surface, you can generate a profile of the roadway that you can use to design the finished ground alignment. .
Overview of Viewing and Editing Roads in Profile View After you draft and define a horizontal alignment for a road, you can create a road profile (also known as a vertical alignment or long section) that represents the existing and finished grades along the roadway centerline. To work in profile view, start by creating an existing ground profile for a defined alignment by sampling elevation data from a surface.
Creating Existing Ground Profiles You can draft an existing ground profile in your drawing and then add vertical alignment geometry to represent what the final roadway will look like in profile view. The following illustration shows existing ground profiles drawn in different directions. To generate the station/elevation information required to plot a profile, you can extract data from a surface or from an ASCII text file, or you can type in station/elevation values using the profile editor.
To create an existing ground profile Steps Use 1 From the Alignments menu, choose Select Current Alignment to make sure that the proper alignment is set as current. Make an Alignment Current 2 Sample the existing ground data (either from a terrain model surface, an ASCII text file, or manual input) by using one of the commands in the Profiles ➤ Existing Ground menu.
The following illustration shows a vertical tangent. The following illustration shows a vertical curve based on passing sight distance. Key Concepts ■ ■ ■ ■ ■ In addition to the finished ground profile, you can design ditches and transitions in profile view. You can use the Create Tangents commands on the Profile menu, or the AutoCAD LINE command to draw vertical tangents, but you must use the Vertical Curves commands to draw vertical curves.
To create a finished ground profile centerline Steps Use 1 Draft the existing ground profile. Overview of Creating Profiles 2 From the Profiles menu, choose FG Centerline Tangents ➤ Set Current Layer to set the current layer. Set the Current Layer for the Finished Ground Profile Centerline 3 From the Profiles menu, choose FG Centerline Tangents ➤ Create Tangents to draw proposed tangents based on stations, elevations, lengths, and grades.
Editing Vertical Alignments You can edit any existing ground or finished ground vertical alignment using a tabular editor called the Vertical Alignment Editor. If you have sampled the existing ground surface, then you can use this editor to view or edit the information that was generated. You can also use this editor to create existing ground or finished ground information.
To edit a vertical alignment Steps Use 1 From the Profiles menu, choose Existing Ground ➤ Edit Vertical Alignment to display the Vertical Alignment Editor. Create and Edit the Vertical Alignment Data with the Vertical Alignment Editor to look up 2 Select the vertical alignment that you want to edit from the Vert. Alignment list. 3 You can edit elevations, points of intersection, and vertical curves.
6 Viewing and Editing Roads in Section View In this chapter To design a roadway in cross-sectional view, create a ■ Overview of Viewing and Editing Roads in Section View ■ Creating Existing Ground Sections Along a Road ■ Working with Templates ■ Creating Finished Ground Cross Sections ■ Editing Cross Sections ■ Transitioning a Roadway ■ Modifying a Roadway Slope ■ Superelevating a Roadway ■ Using Roadway Data for Finished Ground Surfaces roadway template and apply it to the plan alignmen
Overview of Viewing and Editing Roads in Section View After you have created an alignment and profile for a roadway, you can generate cross sections. Cross sections are cut at stations along an alignment.
To generate existing ground cross sections Steps Use 1 From the Alignments menu, choose Set Current Alignment to make sure that the proper alignment is set as current. Make an Alignment Current 2 Generate existing ground section data using one of the commands in the Cross Sections ➤ Existing Ground menu. Sample the Existing Ground Section Data from One DTM Surface The data can be extracted from a terrain model, from a station/offset/elevation ASCII text file, or from manual data entry.
To generate existing ground cross sections (continued) Steps Use to look up 5 You can plot a single section, a page of sections, or all sections by selecting a command from the Cross Sections ➤ Section Plot menu. Plot a Single Cross Section 6 Sections are plotted into the drawing based on the current horizontal and vertical scales. Plot Multiple Cross Sections Working with Templates To create finished ground cross sections, you need to use a design template.
The following illustration shows the points you need to pick when drawing symmetrical and asymmetrical templates. ■ ■ ■ ■ To apply transition and superelevation regions on the template, you must edit the template after you define it. Templates can be made up of normal and subgrade surfaces. Normal surfaces are the elements of the template which make up the main part of the template such as pavement surfaces, median islands, shoulders, and curbs.
To work with templates Steps Use to look up 1 From the Cross Sections menu, choose Templates ➤ Draw Template to draw the finished ground template. Draw a Template Surface General Procedure 2 If you want to use a subassembly for a curb or shoulder, then use the Draw Template command to draw the subassembly. From the Cross Sections menu, choose Templates ➤ Define Subassembly to define the subassembly.
Creating Finished Ground Cross Sections Before creating finished ground sections, you must: ■ ■ ■ ■ Define a road alignment. Draw and define a finished ground centerline vertical alignment. Have an available road template that you can apply. If no template is available, then you need to draw and define the template. Create existing ground cross sections. The finished ground sections include elevational information, a surface template, slopes, and optional ditches.
To create finished ground cross sections Steps Use 1 From the Alignments menu, choose Set Current Alignment to make the correct alignment current. Make an Alignment Current 2 From the Profiles menu, choose Set Current Profile to make the correct profile current. Make a Profile Current 3 If you are applying superelevation to the alignment, then set up the superelevation parameters. From the Cross Sections menu, choose Design Control ➤ Superelevation Parameters.
Editing Cross Sections After you create finished ground cross sections, you can edit the Design Control and re-process a specific range of sections, or all of the sections. You can also edit sections one-by-one if preferred, which is the recommended method for editing the superelevation regions. Edit Design Control Select Edit Design Control to edit a range of sections. The Design Control dialog box is shown in the following illustration.
View/Edit Sections Use the View/Edit Sections command to view and edit sections oneby-one. The following illustrations show how sections appear when you use the View/Edit Sections command. What you see using the View/Edit Sections command Station 42+00 Station 42+50 Station 43+00 The following command prompt is displayed when you use the View/Edit Sections command. You can use the Next, Previous, and Station options to move to a section you want to view or edit.
Transitioning a Roadway To transition a road, you can create plan and profile transition regions on your finished roadway design. For example, if your highway design includes a passing lane on a hill, you can add the additional lane to the plan view of the roadway, define the edge of pavement as a transition alignment, and then update the cross sections using the Edit Design Control command.
To transition a roadway (continued) Steps Use 3 Draw and define the horizontal or vertical transition alignments. Define a Ditch or Transition as a Horizontal Alignment For example, you can draw a horizontal transition alignment for a passing lane, or a vertical transition alignment for a ditch. 4 From the Cross Sections menu, choose Design Control ➤ Edit Design Control to apply the transition alignments the template. To attach horizontal alignments, click the Attach Alignments button.
Modifying a Roadway Slope There are several methods that you can use to create match slopes for the cross sections. For each section, you can apply different cut and fill slope conditions to the left and right sides. You can apply simple slopes that follow a linear slope projection (3:1 in cut and 4:1 in fill). You can also specify the use of benching for areas of substantial cut of fill.
The following illustration shows the Slope Control dialog box, which you access from the Edit Design Control command. Key Concepts ■ ■ ■ ■ ■ If you just want to use simple slopes, you only need to use the Edit Design Control command. Simple slopes use the typical cut and fill slope values. Depth control slopes can use different slopes in cut and fill for various depth ranges based on the depth slope tables that you create from the Cross Sections menu, by choosing Design Control ➤ Depth Slope.
To design slopes for a roadway Steps Use to look up 1 Create finished ground cross sections for the roadway. For more information, see “Creating Finished Ground Cross Sections” in this chapter. 2 If you want to use stepped, surface, or depth control slopes, then you must define the slope tables. Select either Depth Slopes, Stepped Slopes, or Surface Slopes from the Cross Sections ➤ Design Control menu.
You can choose one of five superelevation methods for different situations. The following dialog box explains the five methods. The following illustration shows superelevation method A. The cross sections at the bottom of the illustration show cross sections of the crown at even distances along the profile. The illustration shows the rate of change in the superelevation is constant between section A and C.
■ If you used a speed table to draw the spirals for your alignment, some superelevation information, such as the maximum e value, the runoff lengths, and the percent runoff is already defined for the roadway design. To superelevate a roadway Steps Use 1 From the Cross Sections menu, choose Templates ➤ Edit Template to define the superelevation regions on the finished ground template.
Using Roadway Data for Finished Ground Surfaces You can place points into a drawing that relate to a finished road design. You can use these points as data for creating a finished ground surface that contains the roadway data. For example, you can create: ■ ■ ■ Existing ground, top surface, and datum template points Points based on template point codes Catch points and daylight lines The following illustration shows template points inserted into a drawing.
Key Concepts ■ ■ ■ If you want to import top surface points, datum points, or custom point codes, then you must first define these points. From the Cross Sections menu, choose Templates ➤ Edit Template, and then reprocess the cross sections. When you import top surface data or the datum data into the drawing, both ditch and match slope points will be imported. Point codes can include centerline points, ditch points, bench points, catch points, and so on.
7 Designing Pipe Runs In this chapter ■ Overview of Designing Pipe Runs ■ Drawing and Defining Pipe Runs ■ Importing Plan View Pipe Runs ■ Drafting Conceptual Profile Pipe Runs ■ Editing Pipes Runs Graphically ■ Working with the Pipe Run Editor ■ Drafting Finished Plan Pipe Runs ■ Drafting Finished Profile Pipe Runs Begin pipe design by laying out conceptual plan and profile pipe runs. Import finished draft pipe runs to create symbols and labels.
Overview of Designing Pipe Runs Autodesk Civil Design has a Pipes menu that you can use to design and draft pipe runs in your drawing that represent either storm water or sanitary sewer collection systems. You can start by drawing conceptual pipe runs, represented by single lines, or you can import predefined pipe runs into the drawing. You can use terrain models in order to obtain elevational data for the pipe runs and you can associate a pipe run with a roadway alignment for horizontal location data.
Drawing and Defining Pipe Runs The first step in designing the pipe run is to lay out the conceptual pipe run in your drawing. Conceptual pipe runs are single line representations of plan and profile view pipe runs. They serve as quick sketches of pipe run configurations, which you can use to check a particular pipe run for proper layout and location.
To draw and define a pipe run Steps Use 1 From the Projects menu, choose Drawing Settings to display the Edit Settings dialog box. Overview of Changing the Pipe Settings to look up Or, from the Pipes menu, choose Settings ➤ Edit to display the Pipes Settings Editor. 2 In the Program list, select Civil Design. In the Settings list, select Pipeworks, then click Edit Settings to display the Pipes Settings Editor dialog box.
To draw and define a pipe run (continued) Steps Use 4 From the Pipes menu, choose Define Pipe Runs ➤ Draw Pipe Run, and then type a new pipe run name. Draw and Define Pipe Runs to look up Select a terrain model (if a surface is defined in your project). You can use this surface to extract rim elevations for the manhole structures located at each pipe run node. You are prompted to turn on or off the current surface. If you want to enter elevations manually, click Off to turn off the surface.
To draw and define a pipe run (continued) Steps Use to look up 11 Select an alignment option. You can create an alignment from the pipe run you just drew, or you can associate the pipe run with an existing alignment or the current alignment. If you select the Create an Alignment from Run option, then you will be prompted to select the alignment start point and the entities that make up the pipe run alignment, just like when you define a roadway alignment.
Drafting Conceptual Profile Pipe Runs You can draft a conceptual pipe run in profile view if you associated the plan pipe run with an alignment or defined an alignment from the pipe run. You can use the conceptual profile view of the pipe run to check for problems with inverts and to make graphical edits to the run in profile view. Key Concepts Draft a profile in your drawing for the alignment that you are associating with the pipe run.
To draft a conceptual profile pipe run (continued) Steps 7 You can edit the pipes and nodes of the conceptual profile view from the Pipes menu, by choosing Conceptual Profile ➤ Edit Graphical. If you prefer to edit data using a tabular editor, then from the Pipes menu, choose Conceptual Profile ➤ Edit Data.
To edit a conceptual plan pipe run Steps Use to look up 1 Define a conceptual plan pipe run. 2 From the Pipes menu, choose Conceptual Plan ➤ Edit Graphical. Edit Conceptual Pipe Runs in Plan View 3 Select the run that you want to edit by picking it from the screen, or by pressing ENTER and selecting its name from the dialog box. In this example, you will use the DBase option to change a node name. 4 Move to the node that you want to change by using the Next or Prev options.
Working with the Pipes Run Editor You can use the Pipes Run Editor to edit a conceptual pipe run in a dynamic spreadsheet format dialog box. You can use this dialog box to adjust pipe sizing and flow rate parameters of the pipe runs. You can choose which columns of information that you want to display in the Pipes Run Editor. You can select one of the defined views from the View list to view specific column groupings. For example, you can pick the Node view to view the columns that only pertain to nodes.
■ ■ ■ ■ ■ ■ ■ Pipe segments are listed with pipe size (diameter), start and finish invert elevations, slope, drop, and flow values, as well as roughness coefficients for use in Manning, Darcy-Weisbach, and HazenWilliams pipe flow calculations formulae. Critical flow and depth values for each pipe segment are listed. Contributing flow data from one or two laterals is listed, with lateral names, discharge point invert elevations, and flow values.
Key Concepts ■ ■ ■ ■ ■ ■ You can specify pipe label position, pipe line type, and line text using the Plan Pipe Drafting settings. You can choose which label components to display. You can append prefixes and suffixes to pipe size, slope, material, name, and length labels. You can also specify the precision for size, slope, and length values, and you can add arrows to indicate flow direction. You can select node label station, offset, elevation, and name labels in the Plan Node Drafting settings.
To draft a finished plan pipe run (continued) Steps Use to look up 5 Specify the layers for the finished plan pipe run labels. 6 Specify the option for placing the structure labels: Picking or Offset. If you choose the picking option, then you will be prompted to locate each structure label as it is drawn. 7 Specify whether or not you want to rotate each structure as it is inserted in the drawing. The finished plan pipe run is drawn.
■ ■ You can specify node label station, offset, elevation, and name labels with the Profile Node Drafting settings. You can choose which label components to display. You can append prefixes and suffixes to node station, right or left offset, and pipe, inverts in and out, sump, and rim elevation labels. You can also specify the precision for station, offset, and pipe, sump, and rim elevation values, as well as the text grouping configuration.
8 Plotting Drawings In this chapter ■ Overview of Plotting Drawings ■ Working in Model and Paper Space ■ Creating Label Styles, Sheet Styles, and Frames ■ Setting Up a Plan/Profile Sheet Style ■ Creating a Plan/Profile Sheet Series ■ Creating a Section Sheet Series You can use the Sheet Manager commands to automate plan, profile, and section sheet plotting.
Overview of Plotting Drawings Sheet Manager commands are used to create paper space sheets for plotting that are based on alignments, profiles, and cross sections model space in your drawing. Sheet Manager creates three types of plotted sheets: ■ ■ ■ Profile Sheets: Profile sheets are defined with a single viewport definition. Based on the scale and the size of the viewport, a series of sheets are generated for the alignment’s profile.
The following is an overview of the key concepts in Sheet Manager: Sheet Styles Sheet styles are paper space templates that are used for an alignment. A sheet style is comprised of viewports, frames, and label styles. They are stored in an external folder so that they can be accessed from any drawing. Multiple collections of sheet styles can be created to meet different plot standards. Viewports: Viewports are AutoCAD Paper Space Viewports with additional properties.
Sheet Series There are separate groups of commands for generating series of sheets for plan and profile, profile, or cross sections sheets. A sheet series is defined by a selected sheet style and alignment. The sheet series generates a number of sheet layouts based on the length of profile, or number of sections that can be plotted on an individual sheet to a paper space layout. Each sheet is saved to an external file. These sheets can be loaded into a paper space layout and plotted.
Working in Model Space and Paper Space When you are working with Sheet Manager commands, you work in both paper space (layout mode) and model space. Model space is where you draw and manipulate your objects. You set up sheets to plot in a layout. For the majority of time you work in a layout when you are setting up sheets to plot the Sheet Manager commands. You switch between model space and layout mode by clicking the Model and Layout tabs at the bottom of the drawing window.
Creating Label Styles To understand how to label and set up sheets with the Sheet Manager commands, you should understand the concept of styles. A style applies specific formatting to the information that is contained in your drawing. For example, you can apply a style to a paragraph in a word processing document to make the paragraph indented or bold. A label style works in a similar way. A label style contains information about what to label, as well as how.
When you set up a sheet style, you determine: ■ ■ ■ ■ How the parts of your alignment, profile, or sections appear on sheets. For example, you can draw a plan viewport and assign the category Plan to it. This means that this viewport is reserved for plan views of the alignment. How the labels appear on the sheets by drawing frames. Frames control the placement of labels on the sheet. If you want labels along an alignment, then draw a frame around the plan viewport.
Setting Up a Plan/Profile Sheet Style A sheet style is a 1:1 scale paper space sheet template that typically contains a border, a title block, viewports, frames, and label styles. You can customize a sheet style by creating frames and associating label styles with the frames. Key Concepts ■ ■ ■ ■ You work on sheet styles in paper space (layout mode). Each plan/profile or plan sheet style has viewports to display plan and profile views of the drawing. Section sheets do not use viewports.
To customize a plan/profile sheet style (continued) Steps Use 6 From the Sheet Manager menu, choose Sheet Styles ➤ Text Label to edit or to create label styles. Create a Text Label 7 From the Sheet Manager menu, choose Sheet Styles ➤ Create/Edit Frame to attach label styles to the frames. Attach Label and Grid Styles to a Frame 8 From the Sheet Manager menu, choose Sheet Styles ➤ Save Sheet Style to save the sheet style to the sheet style directory.
To create a plan/profile sheet series Steps 1 From the Sheet Manager menu, choose Settings to set the Sheet Manager preferences. Use to look up Overview of Sheet Manager Settings For plan/profile sheets, you can specify the layer names, whether the sheets are generated with fixed profile stations, and so on. 2 In model space, from the Alignments menu, choose Set Current Alignment to select the current alignment.
To create a plan/profile sheet series (continued) Steps Use 10 You can view one sheet at a time by loading it into paper space. From the Sheet Manager menu, choose Plan/Profile Sheets ➤ Load Sheet - Individual. to look up Load a Generated Plan/Profile Sheet You can only have one sheet loaded into a layout at a time. If you load another sheet, the first sheet will be removed from the layout.
The Section Sheet settings are very important when you are generating section sheets. For example, be sure to configure the horizontal scale correctly so that the section swath width that you sampled fits on the sheets. You can use table frames to position labels on sections sheets that do not have design-specific locations, such as volume calculations. To create a section sheet series Steps Use to look up 1 Create finished ground cross sections using the commands in the Cross Sections menu.
Index 3D grid, roadway, 87 alignment cross sections, 70, 75 editing, 67 profile, 63, 64, 67 superelevating, 83 transitioning, 79 AutoCAD, running with Softdesk programs, 6 breaklines, creating from grading object, 23, 25 Civil Design, 2 documentation, 9 exiting, 14 menus, 7 release 2 features, 8 running with Land Development Desktop, 6 sample projects, 2 starting, 6 contours, grading object, 23, 24 cross sections creating existing ground, 70 editing, 77, 78 finished ground, 75 cul-de-sacs, designing, 59 cu
online Help (continued) Sheet Manager (continued) printing single Help topic, 14 paper space (layout mode), working in, 107 parking lots, adding to drawing, 31 patios and walks, adding to drawing, 31 peak runoff, calculating, 41 pipe runs conceptual profile, 95 designing, 90 drawing and defining, 91 editing graphically, 96 finished plan, 99 finished profile, 101 importing, 94 Pipes Run Editor, 98 printing entire Help file, 11 single Help topic, 14 profile creating existing ground, 63 creating finished gro