
Technical data

Chapter 5 Working with Surfaces
204
■
You can create a range map that displays the cut areas in one color
and the fill areas in another.
■
You can create cut/fill contours on a volume surface. The volume
surface Z value is the cut/fill depth instead of an elevational value.
To present volumes results
Steps
Use
to look up
1
Select the volume surface as the current surface.
Make a Surface Current
2
From the Terrain menu, choose Create Contours
to create cut/fill contours.
Create Contours from a
Surface
3
If you used the grid method to calculate volumes,
then select Terrain
➤
Grid Volumes
➤
Grid
Volume Ticks
to draw grid ticks that display the
elevation difference between existing and
proposed ground.
Create a Grid of Ticks That
Show Cut and Fill Areas on
Volume Surfaces
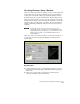
Creating a 3D Map to Present Elevation
Conditions
After you create a surface, you can use several tools to help you
visualize the surface in 3D. For example, you can use the Elevation
and Slope range commands on the Terrain
➤
Surface Display menu to
insert 3D faces into the drawing. These commands place surface
triangles that fall within a defined elevation or slope range onto
specific layers. You can then make each layer a different color. For
example, you can put any portions of the site that fall within an
elevation range of 100' to 105' on a blue layer to visually distinguish
the elevation range.