
2012
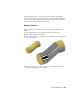


Table Of Contents
- Contents
- Get Information
- The User Interface
- Start and Save Drawings
- Control the Drawing Views
- Organize Drawings and Layouts
- Create and Modify Objects
- Control the Properties of Objects
- Use Precision Tools
- Work with the User Coordinate System (UCS)
- Enter Coordinates to Specify Points
- Use Dynamic Input
- Snap to Locations on Objects (Object Snaps)
- Restrict Cursor Movement
- Combine or Offset Points and Coordinates
- Specify Distances
- Extract Geometric Information from Objects
- Use a Calculator
- Create Objects
- Select and Modify Objects
- Select Objects
- Correct Mistakes
- Erase Objects
- Cut, Copy, and Paste with the Clipboard
- Modify Objects
- Add Constraints to Geometry
- Define and Reference Blocks
- Work with 3D Models
- Create 3D Models
- Overview of 3D Modeling
- Create Solids and Surfaces from Lines and Curves
- Create Solids
- Create Surfaces
- Create Meshes
- Create Wireframe Models
- Add 3D Thickness to Objects
- Modify 3D Models
- Create Sections and Drawings from 3D Models
- Create 3D Models
- Annotate Drawings
- Work with Annotations
- Overview of Annotations
- Scale Annotations
- Overview of Scaling Annotations
- Set Annotation Scale
- Create Annotative Objects
- Display Annotative Objects
- Add and Modify Scale Representations
- Set Orientation for Annotations
- Hatches, Fills, and Wipeouts
- Notes and Labels
- Tables
- Dimensions and Tolerances
- Understand Basic Concepts of Dimensioning
- Use Dimension Styles
- Set the Scale for Dimensions
- Create Dimensions
- Modify Existing Dimensions
- Add Geometric Tolerances
- Work with Annotations
- Plot and Publish Drawings
- Specify Settings for Plotting
- Save Plot Settings as Named Page Setups
- Reuse Named Page Setups
- Specify Page Setup Settings
- Select a Printer or Plotter for a Layout
- Select a Paper Size for a Layout
- Determine the Drawing Orientation of a Layout
- Set the Plot Area of a Layout
- Adjust the Plot Offset of a Layout
- Set the Plot Scale for a Layout
- Set the Lineweight Scale for a Layout
- Select a Plot Style Table for a Layout
- Set Shaded Viewport and Plot Options for a Layout
- Print or Plot Drawings
- Overview of Plotting
- Use a Page Setup to Specify Plot Settings
- Select a Printer or Plotter
- Specify the Area to Plot
- Set Paper Size
- Position the Drawing on the Paper
- Control How Objects Are Plotted
- Preview a Plot
- Plot Files to Other Formats
- Publish Drawings
- Specify Settings for Plotting
- Share Data Between Files
- Reference Other Drawing Files
- Work with Data in Other Formats
- Collaborate with Others
- Render Drawings
- Draw 2D Isometric Views
- Add Lighting to Your Model
- Materials and Textures
- Render 3D Objects for Realism
- Glossary
- Index

Analyze Surface Continuity with Zebra Analysis
The zebra analysis tool projects stripes onto a surface so that you can inspect
the continuity between surfaces.
Surface continuity is a measure of how smoothly two surfaces flow into each
other. A car hood, for example, can be composed of multiple small surfaces
that appear to be one because of the smoothness of the surface continuity.
NOTE
Analysis tools only work in the 3D visual styles; they will not work in 2D.
How to Interpret the Zebra Stripes
In the seam where two surfaces meet, the way that the zebra stripes align and
curve tells you a lot about the smoothness of the join.
G0 Position. The position of the surface edges is collocated; they touch.
But the tangency and curvature do not match. The zebra stripes do not
line up.
G1 Tangency. The position and tangency of surfaces is the same. This
indicates G1 (G0 + G1 or position + tangency). The zebra stripes line up,
but they veer away from one another at sharp curves.
Modify 3D Models | 497