
Manual

36
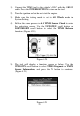
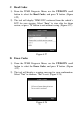
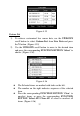
If the ‗One Graphic‘ option is highlighted when a specific item
is selected, the graphic information is available. (Figure 4.32)
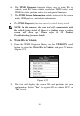
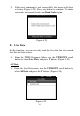
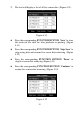
When the sensor data is shown in graph, the tool offers two
more options: Two Graphic and Merge Graphic. The first
option can display two graphs on the same screen (Figure 4.33),
and the last option can merge the two graphs into one. (Figure
4.34).
Figure 4.33
Figure 4.34
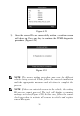
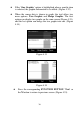
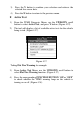
Press the corresponding FUNCTION BUTTON ‗Text‘ or
the N button to return to previous screen. (Figure 4.35)