
User Manual
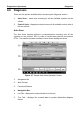
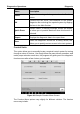
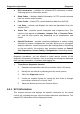
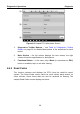
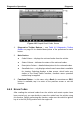
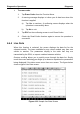
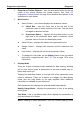
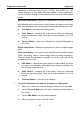
Table Of Contents
- Trademarks
- Copyright Information
- Disclaimer of Warranties and Limitation of Liabilities
- For Services and Support:
- Safety Information
- Contents
- Chapter 1 Using This Manual
- Chapter 2 General Introduction
- Chapter 3 Getting Started
- Chapter 4 Diagnostics Operations
- Chapter 5 Data Manager Operations
- Chapter 6 MaxiFix Operations
- 6.1 Navigation
- The Header
- Select Vehicle Button
- The “Select Vehicle” button on the Header allows you to specify the vehicle which you want to reference on MaxiFix, by selecting each of the vehicle attribute from a sequence of option lists. This feature helps to filter out the searches that allow on...
- 6.1.1 Terminology
- 6.2 Operations
- 6.1 Navigation
- Chapter 7 Settings Operations
- Chapter 8 Shop Manager Operations
- Chapter 9 Update Operations
- Chapter 10 VCI Manager Operations
- Chapter 11 Remote Desk Operations
- Chapter 12 Support Operations
- Chapter 13 Training Operations
- Chapter 14 Quick Link Operations
- Chapter 15 MaxiScope Operations
- 15.1 Safety Information
- 15.2 Glossary
- 15.3 MaxiScope Module
- 15.4 Screen Layout and Operations
- 15.4.1 Top Toolbar
- Math Channel
- A math channel is virtual channel generated by mathematical function of the input channel. It can be displayed in a scope or XY view in the same way as an input signal, and like an input signal it has its own measure axis, scaling and color. The MaxiS...
- Probe
- A probe is any transducer, measuring device or other accessory that you connect to an input channel of your MaxiScope module.
- Reference Waveform
- Recall Reference
- 15.4.2 Functional Buttons
- 15.4.3 Measurement Grid
- 15.4.4 Measurement Rulers
- 15.4.5 Functional Buttons
- 15.4.1 Top Toolbar
- 15.5 Troubleshooting
- 15.6 MaxiScope Firmware Update
- Chapter 16 Digital Inspection Operations
- Chapter 17 Maintenance and Service
- Chapter 18 Compliance Information
- Chapter 19 Warranty

Diagnostics Operations Diagnosis
42
1. Diagnostics Toolbar Buttons – taps the drop-down button at the top
center of the screen displays the toolbar buttons. See Table 4-2
Diagnostics Toolbar Buttons on page 31 for detailed descriptions of the
operations for each button.
2. Main Section
Name Column – this column displays the parameter names.
a) Check Box – taps the check box at the left side of the
parameter name to make selection of an item. Tap the check
box again to deselect the item.
b) Drop-down Button – tapping the drop-down button at the
right side of the parameter name opens a submenu, which
provides various choices for data display mode.
Value Column – displays the values of the parameter items.
Range Column – displays the minimum and the maximum limit
value.
Unit Column – displays the unit for the parameter values.
To change the Unit mode, tap the Setting button on the top toolbar
and select a required mode. See 7.1.1 Unit on page 74 for more
information.
3. Display Mode
There are 4 types of display modes available for data viewing, allowing
you to view various types of parameters in the most suitable way for
better data check-ups.
Tapping the drop-down button on the right side of the parameter name
opens a submenu. There are 4 buttons to configure the data display
mode, plus one Help button on the right, tappable when additional
information is available for your reference.
Each parameter item displays the selected mode independently.
Analog Gauge Mode – displays the parameters in form of an analog
meter graph
Text Mode – this is the default mode which displays the parameters in
texts and shows in list format.
NOTE: Reading of status parameters, such as a switch reading, which