
User's Manual
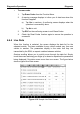
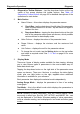
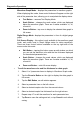
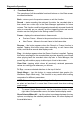
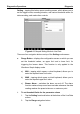
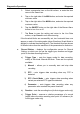
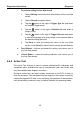
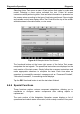
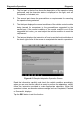
Table Of Contents
- Trademarks
- Copyright Information
- Disclaimer of Warranties and Limitation of Liabilities
- For Services and Support:
- Safety Information
- Contents
- Chapter 1 Using This Manual
- Chapter 2 General Introduction
- Chapter 3 Getting Started
- Chapter 4 Diagnostics Operations
- Chapter 5 Data Manager Operations
- Chapter 6 MaxiFix Operations
- 6.1 Navigation
- The Header
- Select Vehicle Button
- The “Select Vehicle” button on the Header allows you to specify the vehicle which you want to reference on MaxiFix, by selecting each of the vehicle attribute from a sequence of option lists. This feature helps to filter out the searches that allow on...
- 6.1.1 Terminology
- 6.2 Operations
- 6.1 Navigation
- Chapter 7 Settings Operations
- Chapter 8 Shop Manager Operations
- Chapter 9 Update Operations
- Chapter 10 Remote Desk Operations
- Chapter 11 Support Operations
- Chapter 12 Training Operations
- Chapter 13 Quick Link Operations
- Chapter 14 Maintenance and Service
- Chapter 15 Compliance Information
- Chapter 16 Warranty

Diagnostics Operations Diagnosis
36
Waveform Graph Mode – displays the parameters in waveform graphs
When displaying this mode, three control buttons will appear on the right
side of the parameter item, allowing you to manipulate the display status.
Text Button – resumes Text Display Mode
Scale Button – changes the scale values, which are displayed
below the waveform graph. There are 4 scales available: x1, x2,
x4 and x8.
Zoom-in Button – tap once to display the selected data graph in
full screen
Digital Gauge Mode– displays the parameters in form of a digital gauge
graph
Full Screen Display – this option is only available in the waveform graph
mode, and mostly used in Graph Merge status for data comparison.
There are three control buttons available on t he top right side of the
screen under this mode.
Edit Button – tapping this button opens an edit window, on which
you can set the waveform color and the line thickness displayed
for the selected parameter item.
Scale Button - changes the scale values, which are displayed
below the waveform graph. There are 4 scales available: x1, x2,
x4 and x8.
Zoom-out Button – exits full screen display.
To edit the waveform color and line thickness in a data graph
1. Select 1 to 3 parameter items to display in Waveform Graph mode.
2. Tap the Zoom-in Button on the right to display the data graph in
full screen.
3. Tap the Edit Button, an edit window appears.
4. Select a parameter item on the left column.
5. Select a desired sample color from the second column.
6. Select a desired sample line thickness from the right column.
7. Repeat step 4-7 to edit the waveform for each parameter item.
8. Tap Done to save the setting and exit, or tap Cancel to exit without
saving.