
User's Manual
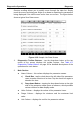
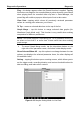
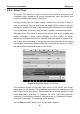
Table Of Contents
- Trademarks
- Copyright Information
- Disclaimer of Warranties and Limitation of Liabilities
- For Services and Support:
- Safety Information
- Contents
- Chapter 1 Using This Manual
- Chapter 2 General Introduction
- Chapter 3 Getting Started
- Chapter 4 Diagnostics Operations
- Chapter 5 Data Manager Operations
- Chapter 6 MaxiFix Operations
- Chapter 7 Settings Operations
- Chapter 8 Shop Manager Operations
- Chapter 9 Update Operations
- Chapter 10 VCI Manager Operations
- Chapter 11 Remote Desk Operations
- Chapter 12 Support Operations
- Chapter 13 Training Operations
- Chapter 14 Quick Link Operations
- Chapter 15 Digital Inspection Operations
- Chapter 16 Maintenance and Service
- Chapter 17 Compliance Information
- Chapter 18 Warranty

Diagnostics Operations Diagnosis
Gesture scrolling allows you to quickly move through the data list. Simply
touch the screen and drag your finger up or down to reposition the parameters
being displayed if the data covers more than one screen. The figure below
shows a typical Live Data screen:
Figure 4-12 Sample Live Data Screen
1. Diagnostics Toolbar Buttons – tap the drop-down button at the top
center of the screen displays the toolbar buttons. See Table 4-2
Diagnostics Toolbar Buttons on page 33 for detailed descriptions of the
operations for each button.
2. Main Section
Name Column – this column displays the parameter names.
a) Check Box - tap the check box at the left side of the parameter
name to make selection of an item. Tap the check box again to
deselect the item.
b) Drop-down Button – tapping the drop-down button at the right
side of the parameter name opens a submenu, which provides
various choices for data display mode.
Value Column – displays the values of the parameter items.
Range Column - displays the minimum and the maximum limit
value.
Unit Column – displays the unit for the parameter values.
44