Trademarks ® TM ® ® ® TM TM Autel , MaxiSys , MaxiDAS , MaxiScan , MaxiTPMS , MaxiVideo , MaxiRecorder , TM and MaxiCheck are trademarks of Autel Intelligent Technology Corp., Ltd., registered in China, the United States and other countries. All other marks are trademarks or registered trademarks of their respective holders.
Safety Information For your own safety and the safety of others, and to prevent damage to the device and vehicles upon which it is used, it is important that the safety instructions herein presented throughout this manual be read and understood by all persons operating, or coming into contact with, the device. There are various procedures, techniques, tools, and parts for servicing vehicles, as well as in the skill of the person doing the work.
Safety Information Important Safety Instructions Do Not Turn the Volume Up Too Loud When Using Headphones Listening at high volumes that over-stimulate the ear for long periods of time may result in loss of hearing. SAFETY WARNINGS: Always perform automotive testing in a safe environment. Wear safety eye protection that meets ANSI standards. Keep clothing, hair, hands, tools, test equipment, etc. away from all moving or hot engine parts.
Contents SAFETY INFORMATION .......................................................................................... II CHAPTER 1 USING THIS MANUAL ..................................................................... 1 1.1 CONVENTIONS .................................................................................................... 1 1.1.1 Bold Text .................................................................................................. 1 1.1.2 Terminology ..................................
4.1 ESTABLISHING VEHICLE COMMUNICATION .............................................................. 19 4.1.1 Vehicle Connection ................................................................................ 19 4.1.2 VCI Connection ...................................................................................... 21 4.1.3 No Communication Message ................................................................ 24 4.2 GETTING STARTED ....................................................................
.1.1 Terminology ........................................................................................... 70 6.2 OPERATIONS..................................................................................................... 71 6.2.1 Home ..................................................................................................... 71 6.2.2 My MaxiFix ............................................................................................ 73 6.2.3 Search Fix ..................................
12.4 12.5 12.6 12.7 12.8 USER COMPLAINT ........................................................................................ 101 DATA LOGGING ............................................................................................ 104 COMMUNITIES ............................................................................................ 105 TRAINING CHANNELS .................................................................................... 107 FAQ DATABASE .......................................
Chapter 1 Using This Manual This manual contains device usage instructions. Some illustrations shown in this manual may contain modules and optional equipment that are not included on your system. Contact your sales representative for availability of other modules and optional tools or accessories. 1.1 Conventions The following conventions are used. 1.1.1 Bold Text Bold emphasis is used to highlight selectable items such as buttons and menu options. Example: Tap OK. 1.1.
Using This Manual Conventions 1.1.5 Procedures An arrow icon indicates a procedure. Example: To use the camera: 1 Tap the Camera button. The camera screen opens. 2 Focus the image to be captured in the view finder. 3 Tap the blue circle. The view finder now shows the captured picture and auto-saves the taken photo.
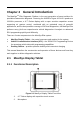
Chapter 2 General Introduction The MaxiSysTM Elite Diagnostic Platform is the next generation of smart solution for specialized automotive diagnosis. Featuring the NVIDIA’s Tegra® 4-PLUS-1 quad-core 1.90GHz processor, a 9.
General Introduction MaxiSys Display Tablet 3. LED Breath Light – indicates battery level & charging status 4. Front Camera 5. Ambient Light Sensor – detects ambient brightness Figure 2-2 MaxiSys Display Tablet Top View 6. Ethernet Port 7. USB Port – for VCI connection 8. HDMI Port 9. Mini USB OTG Port 10. Head Phone Jack 11. DC Power Supply Input Port 12.
General Introduction MaxiSys Display Tablet 2.1.2 Power Sources The MaxiSys Elite can receive power from any of the following sources: Rechargeable Battery Pack AC/DC Power Supply – using power adapter or docking station Vehicle Power Rechargeable Battery Pack The display tablet can be powered with the rechargeable battery, which if fully charged can provide sufficient power for about 6.5 hours of continuous operation.
General Introduction Item Connectivity MaxiSys Display Tablet Description Camera Sensors Audio Input/Output Rear: 8.0 Megapixel, Autofocus with Flashlight Front: 2.0 Megapixel Ambient Light Sensor, G-sensor, Air Gesture Sensing Power and Battery 802.11a/b/g/n/ac WIFI Version 2.1 3Mbs Bluetooth RJ45 Ethernet Connection 3.0 USB (2.0 Compatible) HDMI 1.4a SD Card (Support up to 32GB) 4G Mobile Network (Optional) Microphone Dual Speakers 3-Band 3.
General Introduction 2.2 VCI – J2534 ECU Programming Device VCI – J2534 ECU Programming Device 2.2.1 Functional Description Figure 2-4 J2534 ECU Programming Device 1. Ethernet Port 2. USB Port 3. Power LED - illuminates solid green when powered on 4. Error LED - illuminates solid red when serious hardware failure occurs 5. Bluetooth LED - illuminates solid green when connected with the MaxiSys display tablet through Bluetooth communication 6.
General Introduction VCI – J2534 ECU Programming Device 11. Vehicle Data Connector (DB26-Pin MVCI) 12. External Programming Voltage Output Port 13. A/D Input Port J2534 Reprogramming Capability The J2534 ECU Programming Device is a SAE J2534-1 & -2 compliant PassThru reprogramming interface device.
General Introduction Docking Station 2.2.3 Technical Specifications Item Description Communications Ethernet: RJ45 Ethernet connection Bluetooth USB 2.0 Input Voltage Range 6 VDC to 26 VDC Supply Current 300 mA @ 6 VDC 200 mA @ 12 VDC 110 mA @ 24 VDC Operating Temperature 0°C to +60°C (ambient) Storage Temperature -65°C to +100°C (ambient) Dimensions (L x W x H) 183.8 x 135.5 x 41 (mm) Weight 0.54 kg (1.
General Introduction Accessory Kit 1. DC Power Supply Input Port – connects to the AC/DC adapter for power supply 2. Charging Dock – holds the MaxiSys tablet while providing optimum visibility and convenient charging NOTE: Please make sure no small metal or other conductive parts are around the Charging Dock to avoid short circuit damage to the device. 2.3.2 Technical Specifications 2.
General Introduction Accessory Kit 2.4.2 OBD I Adapters The OBD I adapters are for Non-OBD II vehicles. The adapter used depends on the type of vehicle make being tested. The most common adapters are shown below. VW/Audi-2+2 Chrysler-16 BMW-20 Kia-20 Nissan-14 GM/Daewoo-12 Honda-3 Fiat-3 PSA-2 Mitsubishi/Hy undai-12+16 Benz-38 2.4.3 Other Accessories Standard 2.0 USB Cable Connects the display tablet to the VCI unit. Mini USB Cable Connects the display tablet to the PC.
General Introduction Accessory Kit Compact Disc (CD) Includes the User Manual, Printing Services Program and Update Application, etc. Ethernet Serial Cable Connects the display tablet to the VCI unit. Cigarette Lighter Provides power to the display tablet or the J2534 programming device through connection to the vehicle’s cigarette lighter receptacle, as some non-OBD II vehicles cannot provide power via the DLC connection.
Chapter 3 Getting Started Make sure the MaxiSys Display Tablet has a charged battery or is connected to the DC power supply (see 2.1.2 Power Sources on page 5). 3.1 Powering Up Press the Lock/Power button on the top right side of the display tablet to switch the unit on. The system boots up, and shows the lock screen. Press and drag the inner ring to the edge of the circle to unlock the screen; the MaxiSys Job Menu is shown. Figure 3-1 Sample MaxiSys Job Menu 1. Application Buttons 2.
Getting Started Powering Up 3.1.1 Application Buttons The Application buttons configure the MaxiSys for the type of operation or activity to be performed. The table below gives brief descriptions of the available applications. Use the stylus pen or your finger tip to select an application from the Job Menu. Table 3-1 Applications Name Button Description Diagnostics Configures the unit to operate as a diagnostic tool. See Diagnostics Operations on page 19.
Getting Started Name Powering Up Button Description Training Allows you to store and play technical tutorial and training videos about the device usage or vehicle diagnostic techniques. See Training Operations on page 109. Quick Link Provides associated website bookmarks to allow quick access to product update, service, support and other information. See Quick Link Operations on page 111.
Getting Started Powering Down Name Button Description VCI Opens the VCI Manager application. The tick icon at the bottom right corner indicates the display tablet is communicating with the VCI device, otherwise a cross icon displays. MaxiSys Shortcut Returns to the MaxiSys operation interface from other Android applications. Multi Task Tapping this button opens up a Multi Task menu, on which displays the active running application bookmarks.
Getting Started Install Computer Software To power down the MaxiSys tablet: 1. Press and hold the Lock/Power Button. 2. Tap OK; the tablet will turn off in a few seconds. 3.2.1 Reboot System In case of system crash, press and hold the Lock/Power button for 8 seconds to reboot the system. 3.3 Installing Computer Software The MaxiSys Elite Diagnostic Platform allows you to realize some of its functions on a computer to enhance capabilities and improve user experience.
Getting Started Install Computer Software printing through the computer: To perform printing through the computer 1. Install the PC Link (Printing Services program) to the computer. 2. Make sure the display tablet is connected to the computer network, either via Wi-Fi or LAN, before printing. See 7.1.3 Printing Setting on page 79 for more information. 3. Run the Printing Services program on the computer. 4.
Chapter 4 Diagnostics Operations By establishing a data link to the electronic control systems of the vehicle being serviced through the VCI device, the Diagnostics application allows you to retrieve diagnostic information, view live data parameters, and perform active tests. The Diagnostics application can access the electronic control module (ECM) for various vehicle control systems, such as engine, transmission, antilock brake system (ABS), airbag system (SRS) and more. 4.
Diagnostics Operations Establishing Vehicle Communication OBD II Vehicle Connection This type of connection only requires the main cable without any additional adapter. To connect to an OBD II vehicle 1. Connect the main cable’s female adapter to the Vehicle Data Connector on the VCI device, and tighten the captive screws. 2. Connect the cable’s 16-pin male adapter to the vehicle’s DLC, which is generally located under the vehicle dash.
Diagnostics Operations Establishing Vehicle Communication To connect the cigarette lighter 1. Plug the DC power connector of the cigarette lighter into the DC power supply input port on the device. 2. Connect the male connector of the cigarette lighter into the vehicle’s cigarette lighter receptacle. To connect the clipper cable 1. Connect the tubular plug of the clipper cable to the male connector of the cigarette lighter. Figure 4-1 Connection between Cigarette Lighter and Clipper Cable 2.
Diagnostics Operations Establishing Vehicle Communication Pairing Up via Bluetooth Among all methods, Bluetooth pairing is recommended as the first choice for the communication between the MaxiSys display tablet and the VCI device. The working range for Bluetooth communication is about 755 feet (230 m); this means you can perform vehicle diagnosis freely around the workshop with greater convenience.
Diagnostics Operations Establishing Vehicle Communication USB Cable Connection The USB cable connection is a simple and quick way to establish communication between the MaxiSys display tablet and the VCI device.
Diagnostics Operations 6. Establishing Vehicle Communication If Manual is selected, you need to set the IP address on your own. NOTE: If you are not sure about the specific IP address values, please contact your network administrator. 7. Tap Apply to set up the wired network connection. When the wired network is successfully connected, the connection status is displayed as Connected, and the two status lights at the corners alongside the Ethernet Ports on the display tablet illuminate.
Diagnostics Operations B. 4.2 Getting Started In case of wired connection, check the cable connection between the display tablet and the VCI device. Check if the green LED on the VCI device is illuminated for Bluetooth, Ethernet, or USB.
Diagnostics Operations Getting Started Figure 4-2 Sample Vehicle Menu Screen 1. Top Toolbar Buttons 2. Manufacturer Buttons Top toolbar Buttons The operations of the Toolbar buttons at the top of the screen are listed and described in the table below: Table 4-1 Top Toolbar Buttons Name Button Description Home Returns to the MaxiSys Job Menu. VIN Scan Touching this button opens a dropdown list; tap Auto Detect for auto VIN detection; tap Manual Input to enter VIN manually.
Diagnostics Operations Name Vehicle Identification Button Description Europe Displays the European vehicle menu. Asia Displays the Asian vehicle menu. Domestic Displays the Domestic vehicle menu. Search Touching this button opens the virtual keyboard, allowing you to manually enter the specific vehicle make required. Cancel Touching this button exits the search screen, or cancels an operation. Manufacturer Buttons The Manufacturer buttons display the various vehicle logos and the brand names.
Diagnostics Operations Vehicle Identification To perform Auto VIN Scan 1. Tap the Diagnostics application button from the MaxiSys Job Menu. The Vehicle Menu displays. (Figure 4-2) 2. Tap the VIN Scan button on the top toolbar. 3. Select Auto Detect. The tester starts VIN scanning on the vehicle’s ECU. Once the test vehicle is successfully identified, the system will guide you to the Vehicle Diagnostics screen directly. Figure 4-3 Sample Vehicle Diagnostics Screen 4.3.
Diagnostics Operations Vehicle Identification Figure 4-4 Manual VIN Input 5. Tap Done. The vehicle will be identified in a few seconds, and once the matching is successful, the system will guide you to the Vehicle Diagnostics screen directly. (Figure 4-3) 6. Tap Cancel to exit Manual Input. 4.3.3 Manual Vehicle Selection When the vehicle’s VIN is not automatically retrievable through the vehicle's ECU, or the specific VIN is unknown, you can choose to select the vehicle manually.
Diagnostics Operations B. Vehicle Identification Manual Vehicle Entry This mode allows you to manually enter and save specific vehicle information, such as PCM Part Number, Vehicle Calibration Number, or Tear Tag. This function enables direct access to the vehicle's ECM and saves your time of doing step-by-step entry selections. To perform Manual Vehicle Entry - take Ford for example 1. Tap the Diagnostics application button from the MaxiSys Job Menu. The Vehicle Menu displays. (Figure 4-2) 2.
Diagnostics Operations Vehicle Identification Figure 4-6 PCM Part Number Input Screen 7. Tap OK to continue when the input is done. A confirming screen showing the Vehicle Information displays. 8. Check if the vehicle information is correct, and then from the confirming screen, select: 9. C. a) Yes to continue. b) No to return to the vehicle selection menu. Select Yes and the vehicle diagnostics screen displays.
Diagnostics Operations 5. 6. Navigation Check if the vehicle information is correct, and then from the confirming screen, select: a) Yes to continue. b) No to return to the vehicle selection menu. Select Yes and the Vehicle Diagnostics screen displays. (Figure 4-3) 4.3.
Diagnostics Operations Navigation 1. Diagnostics Toolbar 2. Status Information Bar 3. Main Section 4. Functional Buttons Diagnostics Toolbar The Diagnostics toolbar contains a number of buttons that allow you to print or save the displayed data and make other controls. The table below provides a brief description for the operations of the Diagnostics toolbar buttons: Table 4-2 Diagnostics Toolbar Buttons Name Button Description Home Returns to the MaxiSys Job Menu.
Diagnostics Operations Name Button Navigation Description Records the communication data and ECU information of the test vehicle. The saved data can be reported and sent to the technical center via the Data internet. Logging You can go to the Support application to follow up the processing progress, see Data Logging on page 104 for detailed information. Tapping this button submits the Data Logging report Send to the technical center via the internet.
Diagnostics Operations 2. Navigation Tap the Data Logging button whenever you want to commit recording for the system communication data. The button displays blue during the active recording process. 3. Tap the button again to finish recording. A submission form will display to let you fill in the report information. 4. Tap the Send button to submit the report form via the internet, a confirmation message displays when sending is successful.
Diagnostics Operations Main Menu Confirmation Messages This type of messages usually displays as an “Information” screen, which informs you when you are about to perform an action that cannot be reversed or when an action has been initiated and your confirmation is needed to continue. When a user-response is not required to continue, the message displays briefly before automatically disappearing.
Diagnostics Operations Diagnosis The Vehicle Diagnostics screen (Figure 4-3) has three main options: 1. Diagnosis – a comprehensive section which includes all available functions: reading, clearing, saving and printing diagnostic information, as well as performing active tests and special functions 2. Service – a separate section designed to perform vehicle scheduled service and maintenance, such as to reset the service lights and perform calibration for various systems 3.
Diagnostics Operations Diagnosis Figure 4-8 Sample Auto Scan Operation Screen 1. Navigation Bar 2. Main Section 3. Functional Buttons Navigation Bar 1. List Tab – displays the scanned data in list format 2. Tree Tab – display the scanned data in system distribution diagram format 3. Progress Bar – indicates the test progress Main Section A.
Diagnostics Operations Diagnosis -?-: Indicates that the vehicle control system has been detected, but the tester cannot accurately locate it. Fault | #: Indicates there is/are detected fault code(s) present; “#” indicates the number of the detected faults. Pass | No Fault: Indicates the system has passed the scanning process and no fault has been detected. B. Tree Tab The tree tab screen displays a system distribution diagram of the vehicle control modules.
Diagnostics Operations Diagnosis Control Units This option allows you to manually locate a required control system for testing through a series of choices. You simply follow the menu driven procedure, and make proper selection each time; the program will guides you to the diagnostic function menu after a few choices you’ve made. Figure 4-9 Sample Function Menu Screen The Function Menu options vary slightly by different vehicles.
Diagnostics Operations Diagnosis Special Functions – provides component adaptation or variant coding functions for custom configurations, and also allows you to reprogram adaptive values for certain components after making repairs. Depending on the test vehicle, this selection may sometimes appear as Control Unit Adaptations, Variant Coding, Configuration or something similar.
Diagnostics Operations 1. Diagnosis Diagnostics Toolbar Buttons – see Table 4-2 Diagnostics Toolbar Buttons on page 33 for detailed descriptions of the operations for each button. 2. Main Section – the left column displays the item names; the right column shows the specifications or descriptions. 3. Functional Button – In this case, only a Back (or sometimes an ESC) button is available; tap it to exit after viewing. 4.6.
Diagnostics Operations 3. Diagnosis Status Column – indicates the status of the retrieved codes. Description Column – detailed descriptions for the retrieved codes. Snowflake Icon – only displays when freeze frame data is available for viewing; Selecting displays a data screen, which looks very similar to the Read Codes interface, therefore same operation method may be applied.
Diagnostics Operations Diagnosis Gesture scrolling allows you to quickly move through the data list. Simply touch the screen and drag your finger up or down to reposition the parameters being displayed if the data covers more than one screen. The figure below shows a typical Live Data screen: Figure 4-12 Sample Live Data Screen 1. Diagnostics Toolbar Buttons – tap the drop-down button at the top center of the screen displays the toolbar buttons.
Diagnostics Operations 3. Diagnosis To change the Unit mode, tap the Setting button on the top toolbar and select a required mode. See 7.1.1 Unit on page 78 for more information. Display Mode There are 4 types of display modes available for data viewing, allowing you to view various types of parameters in the most suitable way for better data check-ups. Tapping the drop-down button on the right side of the parameter name opens a submenu.
Diagnostics Operations 4. Diagnosis Edit Button – tapping this button opens an edit window, on which you can set the waveform color and the line thickness displayed for the selected parameter item. Scale Button - changes the scale values, which are displayed below the waveform graph. There are 4 scales available: x1, x2, x4 and x8. Zoom-out Button – exits full screen display. To edit the waveform color and line thickness in a data graph 1.
Diagnostics Operations Diagnosis Flag – this button appears when the Record function is applied. Tapping this button sets flags for the recorded data at points wherever you choose, when playing back the recorded video clip later in Data Manager, the preset flag will enable a popup to allow input of text to take notes. Clear Data –tapping which clears all previously retrieved parameter values at a cutting point whenever you choose. To Top – moves a selected data item to the top of the list.
Diagnostics Operations Diagnosis There are 4 navigation buttons on top of the Setting mode screen. Range Button – displays the configuration screen on which you can set the threshold values, an upper limit and a lower limit, for triggering the buzzer alarm. This function is only applied to the Waveform Graph display mode.
Diagnostics Operations a) Diagnosis Trigger Type – sets the trigger mode for data recording, mainly of two kinds: Manual and Auto.
Diagnostics Operations Diagnosis 4.6.5 Active Test The Active Test function is used to access vehicle-specific subsystem and component tests. Available test vary by manufacturer, year, and model, and only the available tests display in the menu. During an active test, the tester outputs commands to the ECU in order to drive the actuators.
Diagnostics Operations Diagnosis 4.6.6 Special Functions These functions perform various component adaptations, allowing you to recalibrate or configure certain components after making repairs or replacement. The main section of the Adaptation Operation screen displays a list of operational and vehicle status information, which mainly consists of four parts: 1.
Diagnostics Operations Service Read the information carefully and check the vehicle condition accordingly, when you are sure that the vehicle is ready to perform the adaptation, simply follow the instruction provided to make appropriate selections. When the operation is done, an execution status message such as Completed, Finished or Successful, displays. Tap the ESC button to exit the function. 4.
Diagnostics Operations Programming and Coding Electric Parking Brake (EPB) Service This function has a multitude of usages to maintain the electronic braking system safely and effectively. The applications include deactivating and activating the brake control system, assisting with brake fluid control, opening and closing brake pads, and setting brakes after disc or pad replacement, etc.
Diagnostics Operations Programming and Coding The Programming and Coding function is used to re-flash the vehicle control modules, it allows you to update the computer software on the vehicle to the latest version, as well as to reprogram adaptive data for certain components after making repairs or replacements.
Diagnostics Operations Programming and Coding Variant Coding Figure 4-16 Sample Variant Coding Screen The main section of the Variant Coding screen displays a list of vehicle components and the coding information which mainly consists of three parts: 1. The top line on the list displays the instruction of how to use the functional button at the lower right corner of the screen to manipulate the coding operations. 2.
Diagnostics Operations Programming and Coding Reprogramming Operation Typical reprogramming operations require you to input and validate VIN number first. Tap the input box and enter the correct number, the programming interface then displays.
Diagnostics Operations Generic OBD II Operations Occasionally a flash update procedure may not complete properly. Common causes of flash errors include poor cable connections between the display tablet, VCI, and vehicle, turning off the vehicle ignition switch before the flash procedure is complete, or low vehicle battery voltage. If the process crashes, recheck all the cable connections to assure good communications and reinitialize the flash procedure.
Diagnostics Operations 3. Generic OBD II Operations Select a specific protocol if the Protocol option is selected. Wait for the OBD II Diagnostic Menu to appear. Figure 4-18 Sample OBD II Diagnostic Menu i button displayed beside the function name is tappable, NOTE: The ○ tapping which opens a bubble with additional function information. A 4. E A Select a function option to continue.
Diagnostics Operations Generic OBD II Operations 4.9.2 Function Descriptions This section describes the various functions of each diagnostic option: DTC & FFD When this function is selected, the screen displays a list of Stored Codes and Pending Codes. When the Freeze Frame data of certain DTCs are available for viewing, a snowflake button will display on the right side of the DTC item. The Erase Codes function can be applied by tapping the functional button at the lower bottom of the screen.
Diagnostics Operations Generic OBD II Operations a) If a test failed during the driving cycle, the DTC associated with that test is reported. If the pending fault does not occur again within 40 to 80 warm-up cycles, the fault is automatically cleared from memory. b) Test results reported by this service do not necessarily indicate a faulty component or system.
Diagnostics Operations Generic OBD II Operations Live Data This function displays the real time PID data from ECU. Displayed data includes analog inputs and outputs, digital inputs and outputs, and system status information broadcast on the vehicle data stream. Live data can be displayed in various modes, see 4.6.4 Live Data on page 43 for detailed information.
Diagnostics Operations Exiting Diagnostics 4.10 Exiting Diagnostics The Diagnostics application remains open as long as there is an active communication with the vehicle. You must exit the diagnostics operation interface to stop all communications with the vehicle before closing the Diagnostics application. NOTE: Damage to the vehicle electronic control module (ECM) may occur if communication is disrupted.
Chapter 5 Data Manager Operations The Data Manager application is used to store, print, and review the saved files. Most operations are controlled through the toolbar. Selecting the Data Manager application opens the file system menu. Different file types are sorted separately under different options, there are six types of information files to be viewed or played back. Figure 5-1 Sample Data Manager Main Screen 5.
Data Manager Operations Operations Figure 5-2 Sample Image Database Screen 1. Toolbar Buttons – used to edit, print and delete the image files. See Table 5-1 Toolbar Buttons in JPG Database on page 64 for detailed information. 2. Main Section – displays the stored images. Table 5-1 Toolbar Buttons in JPG Database Name Button Description Back Returns to the previous screen. Enter Edit Touching this button shows the editing toolbar to print, delete or view image information.
Data Manager Operations Operations To edit image information 1. Select Data Manager application from the MaxiSys Job Menu. 2. Select Image to access the JPG database. 3. Select an image to display it in full screen. 4. Tapping the screen once displays the editing toolbar. 5. Tap the Info button to open a window displaying the image information. 6. Tap the Edit button on the top right corner of the window. The editing screen displays. 7.
Data Manager Operations Operations 5.1.3 Review Data The Review Data section allows you to playback the recorded data frames of live data streams. On the Review Data main screen, select a record file to playback. Figure 5-3 Sample Data Playback Screen 1. Drop-down Toolbar – tap the button at the top center of the screen to open the Drop-down Toolbar 2. Main Section – displays the recorded data frames 3.
Data Manager Operations Operations Select the vehicle firmware you want to delete by tapping on the car brand icon, the selected item will display a blue tick at the upper right corner. Tap the Delete button on the top bar to delete the firmware from the system database. 5.1.5 Data Logging The Data Logging section allows you to launch Support platform directly to view all records of every sent or unsent (saved) data logging on the diagnostic system. For more details, please refer to 12.
Chapter 6 MaxiFix Operations The MaxiFix application launches the on-line troubleshooter database, which not only provides you virtually all common diagnostic trouble code (DTC) database for most vehicles, but also serves as a forum allowing you to network with other MaxiSys users, and gives you access to a vast database of repair and diagnostic tips along with proven filed fixes.
MaxiFix Operations Navigation The MaxiFix interface has 3 main areas: 1. Header Bar – located across the top of the page, is used to select vehicles and perform keyword searches. 2. Navigation Bar – located along the left-hand side of the page is used to access the main features of MaxiFix. 3. Main Screen – The center portion of the page presents content based on the vehicle attributes and keywords selected. The main screen also has tabs that allow you to switch between functions.
MaxiFix Operations Navigation 6.1.1 Terminology MaxiFix Tip MaxiFix Tips are concise and complete descriptions of a real fix for a particular vehicle repair issue. A MaxiFix Tip is a combination of proven fixes and vehicle specific data we have collected and analyzed into an all-in-one information source to help you fix vehicle problems quickly and easily. On MaxiFix you can search for Tips or enter your own Tip to help other community members resolve vehicle issues.
MaxiFix Operations 6.2 Operations Operations The Navigation Bar is on the left side of the screen. Buttons on the Navigation Bar launch the main sections of MaxiFix. Available Navigation Bar selections include: Home – shows the recently viewed questions and fixes, the Leaderboard, along with a link to your profile information. My MaxiFix – shows all your posts including Questions and Tips in the community, and allows you to ask a question and enter a tip.
MaxiFix Operations Operations To show on the Leaderboard the community members must answer questions to get points. Points System 3 points are awarded when you close a question. 2 points are awarded if your closed question is picked as "Fixed it!" by no less than 20 community members. 4 points are awarded if your answer is rated as the “Best Answer”.
MaxiFix Operations 4. Operations Communication – lets you manage your communication preferences. Here you can choose which email notifications you would like to receive from MaxiFix. 6.2.2 My MaxiFix My MaxiFix, the second option on the Navigation Bar along the left side of the screen, opens your personal MaxiFix page. To access the features on My MaxiFix page you can either select from the tabs or use the links on the top of the page:.
MaxiFix Operations Operations The Question page has 4 sections: Subject – this is where you enter a brief subject for the question. Symptoms – this is where you describe how the vehicle is behaving. Diagnostics Steps Performed/Parts Replaced – include any previous diagnostic tests that you performed, including the results of the tests. Also list any parts that were replaced during previous diagnostic work. Your Question – ask a clear and concise question that you want to ask the community.
MaxiFix Operations Operations experience before closing a question. Your question will be converted to a MaxiFix Community Tip after closing. Create a Tip If you have a new fix to a specific vehicle problem please share! Create a MaxiFix community Tip to share your expertise with other technicians in the MaxiFix community. A MaxiFix community Tip is a short yet complete description of the repair for a particular vehicle problem. To create a new MaxiFix Tip 1.
MaxiFix Operations Operations Tips – presents a list of Tips that directly correlate to your search criteria. Select a Tip from the list to open and review the complete Tip. Real Fixes – presents a list of Tips that have been gathered from actual shop repair orders and are presented in an easy to understand Complaint, Cause, Correction format. 6.2.
MaxiFix Operations 2. Operations Your answer is rated as the “Best Answer” by the MaxiFix community member who asked the question. Tap My Message, select the message notification you want to read in the list. If your answer is rated as the “Best Answer”, the prompt “Best Answer + 4” will be displayed permanently. Tap Clear to delete all message notifications in the list. 6.2.
Chapter 7 Settings Operations Selecting Settings application opens a setup interface, on which you can adjust default setting and view information about the MaxiSys system. There are eight options available for the MaxiSys system settings: Unit Language Printing Setting Wired Network Notification Center Multitask About System Settings 7.1 Operations This section describes the operation procedures for the settings. 7.1.
Settings Operations Operations 7.1.2 Language This option allows you to adjust the display language for the MaxiSys Elite system. To adjust the language setting 1. Tap the Settings application on the MaxiSys Job Menu. 2. Tap the Language option on the left column. 3. Select the required language. A tick icon will display to the right of the selected language. 4. Tap the Home button on the top left corner to return to the MaxiSys Job Menu. Or select another setting option for the system setup.
Settings Operations Operations 2. Tap the Wired Network option on the left column. 3. Tap the ON/OFF button to enable the Wired Network connection. If the connectivity is enabled the button turns blue, or if disabled the button turns gray. 4. > button to the right of the Ethernet Configuration option, a Tap the ○ setup window displays. 5. Select a connection type: 6.
Settings Operations 4. Operations Tap the Home button on the top left corner to return to the MaxiSys Job Menu. Or select another setting option for the system setup. When the Notification Center function is turned on, and new messages are received by the MaxiSys device, a notification message displays on the MaxiSys Job Menu. Press on the message bar and drag it down, and the received messages are shown in the list, slide the list up or down to view all if the message list covers more than one screen.
Settings Operations Operations To check the MaxiSys product information in About 1. Tap the Settings application on the MaxiSys Job Menu. 2. Tap the About option on the left column. The product information screen displays on the right. 3. Tap the Home button on the top left corner to return to the MaxiSys Job Menu, or select another setting option for the system setup, after viewing. 7.1.
Chapter 8 Shop Manager Operations The Shop Manager application helps you to manage the workshop information, customer information records, and keep test vehicle history records, which can be a great assist in dealing with daily workshop business and improves customer service.
Shop Manager Operations Name Button Vehicle History Description History Notes Touching this button opens a note form, which allows you to create audio record, attach picture or video, or edit text notes, etc. Vehicle History Touching this button opens the Vehicle History screen which displays the correlated test vehicle records. Done Saves the file when complete editing. 8.
Shop Manager Operations Vehicle History To activate a test session for the recorded vehicle 1. Tap the Shop Manager application on the MaxiSys Job Menu. 2. Select Vehicle History 3. Tap the Diagnostics button at the bottom of the thumbnail of a vehicle record item. Or, 4. Select a vehicle record item by tapping the thumbnail. 5. A Historical Test record sheet displays, check the recorded information of the recorded test vehicle, and tap the Diagnostics button on the upper right corner. 6.
Shop Manager Operations Workshop Information To edit the Historical Test record sheet 1. Tap the Shop Manager application on the MaxiSys Job Menu. 2. Select Vehicle History. 3. Select the specific vehicle history record thumbnail from the main section. The Historical Test record sheet displays. 4. Tap the Edit button to start editing. 5. Tap on each item to input the corresponding information or add attaching files or images.
Shop Manager Operations Customer Manager Figure 8-3 Sample Workshop Information Sheet 8.3 To edit the Workshop Information sheet 1. Tap the Shop Manager application on the MaxiSys Job Menu. 2. Select Workshop Information. 3. Tap the Edit button on the top toolbar. 4. Tap on each field to input the appropriate information. 5. Tap Done to save the updated workshop information sheet, or tap Cancel to exit without saving.
Shop Manager Operations 4. Customer Manager Tap the □ + photo frame beside the Name chart to add a photo. A A E A sub menu displays, select Take Photo to take a new photo for the account, or select Choose Photo to choose from the existing files. 5. Some customers may have more than one vehicle for service; you can always add new vehicle information to the account to be correlated. Tap Add New Vehicle Information, and then fill in the vehicle information. Tap the ○ x button to cancel adding. A 6.
Shop Manager Operations Customer Manager 8.3.1 History Notes The History Notes function allows you to add audio and video records, text notes and photos, to keep multi-media work logs for the associated customer account, which can be very helpful when dealing with repeat customers. Keeping notes for each vehicle serviced for each customer will keep you always on track and well organized in business. To access History Notes 1. Tap the Shop Manager application on the MaxiSys Job Menu. 2.
Shop Manager Operations Customer Manager Table 8-2 Function Buttons in History Notes Name Button Description Back Returns to the previous screen. Delete Touching this button deletes the selected note. Search Quickly locates the required note by entering the note title. Cancel Touching this button to cancel edit or file search. Edit Touching this button opens an edit window allowing you to edit notes and attach files. Add Notes Touching this button to add new note in History Notes.
Chapter 9 Update Operations The internal programming of the MaxiSys Elite Diagnostic System, known as the firmware, can be updated using the Update application. Firmware updates increase the MaxiSys applications’ capabilities, typically by adding new tests, new models, or enhanced applications to the database. The display device automatically searches for available updates for all of the Maxisys components when it is connected to the internet.
Update Operations 3. Operations Main Section Left Column – displays vehicle logos and update firmware version information; tap the About button displays a function list in PDF showing more details about the firmware Middle Column – displays a brief introduction about the new changes to the i button to open an information firmware operation or capabilities. Tap ○ screen to view more details, and tap the dim area around to close the window.
Chapter 10 VCI Manager Operations This application allows you to pair up the MaxiSys Display Tablet with J2534 Programming Device, and to check the communication status. Figure 10-1 Sample VCI Manager Screen 1. Connection Mode – there are three connection modes available for selection. The connection state is displayed alongside. Bluetooth Paring – when paired to a Bluetooth device, the connection state displays as Paired; otherwise it displays as Unpaired.
VCI Manager Operations Bluetooth Pairing number for all of the devices available for pairing. Tap a required device to start pairing. The Bluetooth status icon displayed to the left of the device name indicates the received signal strength. Ethernet Setting – allows you to perform network configuration. 10.1 Bluetooth Pairing The VCI device needs to be either connected to a vehicle or to an available power source, so that it is powered up during the synchronization procedure.
VCI Manager Operations Bluetooth Pairing 11. Tap the Back button on the top left to return to the MaxiSys Job Menu. NOTE: A VCI device can be paired to only one Display Tablet each time, and once it’s been paired, the device will not be discoverable for any other unit. 10.2 Wired Network Connection The Wired Network is applied for connecting the MaxiSys Display Tablet with J2534 ECU Programming Device or to an existing LAN.
VCI Manager Operations Bluetooth Pairing NOTE: If you are not sure about the specific IP address values, please contact your network administrator. 9. Tap Apply to set up the wired network connection. 10. Tap the Back button on the top left to return to the MaxiSys Job Menu. When the wired network is successful connected, the connection status is displayed as Connected, and the two status lights at the corners alongside the Ethernet Ports on the display tablet illuminate.
Chapter 11 Remote Desk Operations The Remote Desk application launches the TeamViewer Quick Support program, which is a simple, fast and secure remote control interface. You can use the application to receive ad-hoc remote support from Autel’s support centre, colleagues, or friends, by allowing them to control your MaxiSys tablet on their PC via the TeamViewer software. 11.
Remote Desk Operations Operations To receive remote support from a partner 1. Power on the MaxiSys Display Tablet. 2. Tap the Remote Desk application on the MaxiSys Job Menu. The TeamViewer interface displays and the device ID is generated and shown. 3. Your partner must install the Remote Control software to his/her computer by downloading the TeamViewer full version program online (http://www.teamviewer.
Chapter 12 Support Operations This application launches the Support platform which synchronizes Autel’s on-line service base station with the MaxiSys display tablet. In order to synchronize the device to your on-line account, you need to register the product through the Internet when you use it for the first time.
Support Operations Support Screen Layout 12.2 Support Screen Layout The Support application interface is navigated by 4 simple buttons on the top navigation bar, operation of each is described below in turn from left to right: Home Button – returns to the MaxiSys Job Menu. Back – returns to the previous screen, each press takes you back one step. Forward – each press moves forward one screen until you’ve reached the last screen visited. Refresh – reload and update the screen.
Support Operations My Account 12.3 My Account The My Account screen displays the comprehensive information of the user and the product, which is synchronized with the on-line registered account, including User Info, Device Info, Update Info and Service Info. Personal Info The User Info and Device Info are both included under the Personal Info section.
Support Operations User Complaint Screen Layout Figure 12-2 Sample Complaint Screen The User Complaint screen consists of two parts. 1. 2. Option Bar Period Filter – displays only the complaint records within the defined period on the list Status Filter – displays the corresponding complaint records according to the selected case status New Complaint Button – starts a new complaint case.
Support Operations User Complaint Waiting Customer Reply – indicates the complaint has been replied by the service personnel, and requires feedback from the customer Closed – indicates the complaint case has been processed, solved, and ended To view the detailed complaint session, tap the ○ > button on the right side of the case item. A E A To establish a new complaint session 1. Register the product online. 2. Tap the Support application on the MaxiSys Job Menu.
Support Operations Data Logging 3. Tap Complaint on the Main Menu. 4. Select an existing complaint case item on the record list by tapping the ○ > button on its right side. The screen displays the complaint session details. A E A 5. Tap the Post Reply button on the upper right side after viewing, to make a reply. An edit screen displays. 6. Input the content in the input field, and if necessary, upload an attaching file. 7. Tap Submit to post the reply. 8.
Support Operations Communities To make a reply in a Data Logging session 1. Tap on the Sent tag to view a list of submitted data loggings. 2. Select a specific item to view the latest update of the processing progress. 3. Tap on the input field at the bottom of the screen, and enter the texts. Or tap the Audio button to record a voice message, or camera button to take a picture. 4. Tap Send to deliver your message to the technical center. 12.
Support Operations Communities 2. Select a desired group according to the subject you are about to discuss. For example, if you are going to ask a question about the MaxiSys Elite tablet, tap MaxiSys to start a discussion. 3. Enter your topic and the discussion content in the appropriate input field. 4. Select a category or edit tags for the discussed post. This will help other members with similar interest to find your post. 5. Tap OK to submit the post.
Support Operations Training Channels Figure 12-5 Sample User Profile Screen Profile – displays the user’s personal information and member status. The Related links allow you to check the Top Users (ranked according to their points and levels) in the communities, as well as to find out other online users. Avatar – allows you to select an image to set as your personal Avatar to be displayed in the communities. Stuff – displays all the discussions you’ve posted at various forums in a list. 12.
Support Operations FAQ Database 12.8 FAQ Database The FAQ section provides you comprehensive and abundant references for all kinds of questions frequently asked and answered about the use of Autel’s online member account, and shopping and payment procedures. Account – displays questions and answers about the use of Autel’s online user account. Shopping & Payment – displays questions and answers about online product purchase and payment methods or procedures.
Chapter 13 Training Operations The Training application provides and allows you to play various tutorial videos stored on the device. The stored training materials mainly consists of product usage tutorials and vehicle diagnostic training videos, all produced by top-notch technicians and product experts. The application also allows you to download or watch more associated videos online, by providing quick links to Autel’s online video database. Figure 13-1 Sample Training Application Screen 1.
Training Operations Operations 2. Main Section – displays the available video files for watching To play a video 1. Tap the Support application on the MaxiSys Job Menu. The Training application screen displays. 2. Select a video file from the main section. 3. Tap the Play button on the left side. 4. Select a Player from the popup window if necessary. Now you can watch the video, it is played in full screen mode.
Chapter 14 Quick Link Operations The Quick Link application provides you with convenient access to Autel’s official website and many other well-known sites in automotive service, which offers you abundant information and resources, such as technical help, knowledge base, forums, training, and expertise consultations, etc. Figure 14-1 Sample Quick Link Screen To open a quick link 1. Tap the Quick Link application on the MaxiSys Job Menu. The Quick Link application screen displays. 2.
Chapter 15 Digital Inspection Operations The Digital Inspection application configures the MaxiSys Elite Diagnostic Device to operate as a digital video scope by simply connecting the tablet to a Digital Inspection Camera. This function allows you to examine difficult-to-reach areas normally hidden from sight, with the ability to record digital still images and videos, which offers you an economical solution to inspect machinery, facilities, and infrastructure in a safe and quick way.
Digital Inspection Operations Additional Accessories 15.1 Additional Accessories The Digital Inspection Camera and its fittings are the additional accessories. Both sizes (8.5 mm and 5.5 mm) of the imager head are optional and available for purchase along with the standard MaxiSys Elite tool kit.
Digital Inspection Operations Additional Accessories Imager Head Accessories Figure 15-2 8.5mm Imager Head Accessories 1. Magnet – picks up small metal objects, such as dropped rings or screws 2. Hook – unclogs obstacles and picks up wires in the pipes or confined areas 3. Mirror – helps to look around corners and see the unreachable areas Figure 15-3 5.5mm Imager Head Accessories 1. Mirror – helps to look around corners and see the unreachable areas 2.
Digital Inspection Operations Additional Accessories 1. Hold the accessory and the imager head. 2. Slip the end of the accessory over the imager head and then fix the accessory. For 5.5mm Imager Head The two accessories, including the Magnet and Mirror (Figure 15-3), can be attached to the Imager Head with the same manner described below: 1. Hold the accessory and the imager head.
Digital Inspection Operations 2. Operations Screw the thread part of the accessory over the imager head to fix the accessory. 15.2 Technical Specifications Item Optimal Viewing Distance Description 1" to 14" (2.54cm to 35.56cm) with 8.5mm diameter imager head Lighting 3/8" to 12" (0.95cm to 30cm) with 5.
Digital Inspection Operations Operations NOTE: When in operation, the imager head cable can be bent into a certain shape. This may help you operate the cable into confined areas. To take pictures using the Digital Inspection application 1. Connect the Imager Head Cable to the USB port on the top side of the MaxiSys Display Tablet. 2. If not already done, power up the MaxiSys Display Tablet. 3. Tap the Digital Inspection application on the MaxiSys Job Menu.
Digital Inspection Operations Operations 4. Select the video icon at the lower right corner to record a video. 5. Properly locate the imager head cable to focus the inspection scene for recording. 6. Tap the red ring on the operating screen to start recording. 7. Tap the red circle again to stop recording. The recorded video is automatically saved to the system Gallery. 8. Tap the thumbnail image on the top right corner to review the recorded video. 9. Tap the Play button to play the video.
Chapter 16 Maintenance and Service To ensure that the MaxiSys Elite diagnostic tablet and the combined VCI unit perform at their optimum level, we advise that the product maintenance instructions covered in this section is read and followed. 16.1 Maintenance Instructions The following shows how to maintain your devices, together with precautions to take. Use a soft cloth and alcohol or a mild window cleaner to clean the touch screen of the tablet.
Maintenance and Service Troubleshooting Checklist 16.2 Troubleshooting Checklist A. B. When the display tablet does not work properly: Make sure the tablet has been registered online. Make sure the system software and diagnostic application software are properly updated. Make sure the tablet is connected to the Internet. Check all cables, connections, and indicators to see if the signal is being received. When battery life is shorter than usual: C.
Maintenance and Service About Battery Usage Do not use a damaged battery charger. Do not disassemble or open crush, bend or deform, puncture or shred. Do not modify or remanufacture, attempt to insert foreign objects into the battery, expose to fire, explosion or other hazard. Make sure to use the charger and USB cables only that come together in the package. If you use the other charger and USB cables, you might incur malfunction or failure of the device.
Maintenance and Service Service Procedures Contact the local distributer or agent. Visit our website http://pro.autel.com or www.autel.com. Repair Service If it becomes necessary to return your device for repair, please download the repair service form from www.autel.com, and fill in the form.
Chapter 17 Compliance Information FCC Compliance This equipment has been tested and found to comply with the limits for a Class B digital device, pursuant to Part 15 of the FCC Rules. These limits are designed to provide reasonable protection against harmful interference in a residential installation. This equipment generates uses and can radiate radio frequency energy and, if not installed and used in accordance with the instructions, may cause harmful interference to radio communications.
Chapter 18 Warranty 12-Month Limited Warranty Autel Intelligent Technology Corp., Ltd.