
Service manual


STP 11-25R13-SM-TG
S - 19
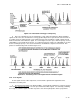
Figure S-18. Distribution of Energy in a Frequency
b. Since the scanning rates for the chrominance (color) and for the luminance (black and white)
signals are the same, the concentrations of energy produced by both are spaced at the same intervals. It
is feasible, therefore, that the bands of concentrated energy of the chrominance signal could be spaced
between the bands of the luminance signal. As seen in Figure S-18, the spaces in the frequency occur at
odd multiples of one-half the line frequency. If a subcarrier frequency equal to an odd multiple of one-half
the line scanning frequency is chosen, the chrominance and luminance signals are interleaved. This
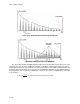
practice is followed today and is shown in Figure S-19.
Figure S-19. Interleaving of the Color Signal with the Luminance Signal
S-20. Color Signals.
A color signal consists of two components, a monochrome signal and the signal that carries
information concerning color.
a. The Monochrome Signal
. The black and white, or monochrome (luminance), portion of the total
color signal is equivalent in all respects to the present black and white signals. It is formed by combining
the red, green, and blue signals from their respective color camera pickup tubes in these proportions: