
Service manual


STP 11-25R13-SM-TG
S - 15
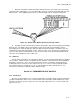
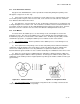
(3) For practical purposes, the three-dimensional Maxwell triangle was converted to a two-
dimensional drawing and was designated the Commission Internationale de I'Eclairage/International
Commission on Illumination (CIE) Chromaticity Diagram. If we examine the diagram in Figure S-14, we
see that the horseshoe curve, which is known as the spectrum locus, is graduated into numerals ranging
from 400 in the left-hand corner to 700 at the extreme right.
Figure S-14. CIE Chromaticity Diagram and the NTSC Triangle
(4) These figures represent the wavelengths of the various colors in nanometers. The blues
extend from approximately 400 to 490 nanometers, the greens extend from approximately 490 to 550
nanometers, the yellows extend from approximately 550 to 580 nanometers, and the reds (including
orange) extend from 580 to 700 nanometers.
(5) Since fully saturated colors contain no white light, the spectrum colors which lie directly on the
horseshoe curve can be said to be 100 percent saturated. At point E in Figure S-14, only white light is
present, so it can be said to be zero percent saturated.
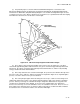
(6) This same principle applies when observing the vectorscope, a device for measuring vector
relationships between the various color signals being transmitted as well as the amount of saturation
present. Various percentages of saturation fall along a straight line drawn between any point on the
spectrum locus and point E on the diagram. As we move more toward point E, the saturation is
decreased. Conversely, as we move toward the curve, the saturation is increased. Thus, we can see
that a 100-percent saturated color is one that has 100-percent purity or freedom from white and that a
desaturated color is a color which contains some amount of white light.