
Users Manual
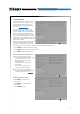
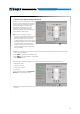
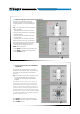
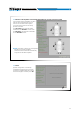
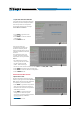
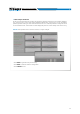
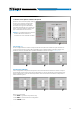
Table Of Contents
- Index
- 1. PRODUCT DESCRIPTION
- 2. PACKAGING CONTENTS
- 3. bit One HD Virtuoso AND DRC MP INSTALLATION
- 4. CONNECTION PANELS - DESCRIPTION
- 5. CONNECTIONS
- 6. bit One HD Virtuoso SOFTWARE AND DRIVERS - INSTALLATION GUIDE
- 7. bit One HD Virtuoso SETUP WITH PC
- 8. bit One HD Virtuoso SETUP USING A PC
- 9. TROUBLESHOOTING
- 10. TECHNICAL SPECIFICATIONS
- 11. ADDENDUM
39
USER'S MANUAL
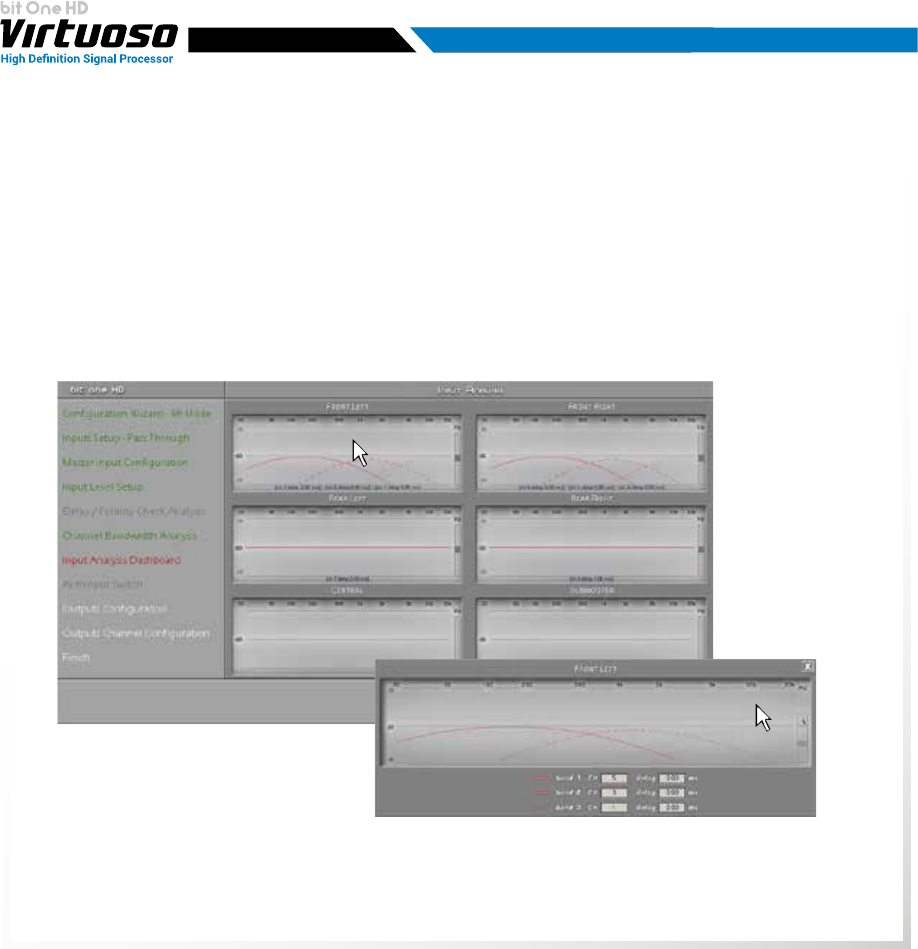
At the end of the procedure the results of the analysis of the interfaced source fronts will be displayed.
The frequency trend of the signal will be displayed (Master EQ), and the trend of any input lters
(XOVER) present. Clicking on each individual chart on the front, it will be possible to enlarge the trend
of each individual front. This window can also display the presence of time delays of the source if any.
- Press BACK to go back to the previous step.
- Press NEXT to continue with the conguration.
- Press CANCEL to exit.
7. INPUT Analysis Dashboard
Remark: this operation has no corrective effect, it is only an analysis.
7