
User guide

26
6310A–ATARM–26-Mar-07
Application Note
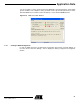
5.3.3 Creating a Flash Configuration
Debugging in Flash is almost the same as debugging in SRAM, except the program must be
flashed prior to execution and is not reloaded when a debug session starts.
To create a Flash debug configuration, do as described in section Section 5.3.2 on page 21 with
two differences:
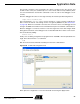
• The binary file selected in the “Main” tab must be the one linked for Flash
•The load command (in the “Commands” tab) must be omitted
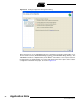
5.3.4 Creating a SDRAM Configuration
Several microcontrollers of the AT91 family can interface with an external SDRAM chip. This
additional memory is useful for debugging programs since it is much larger than internal SRAM.
However, conversely to SRAM, it is not possible to directly load code in the SDRAM, it must be
initialized first. To do this, a GDB command file (“init_sdram.gdb”) is provided with the Getting
Started examples for chips which have an SDRAM controller. The script enables the main oscil-
lator, PLL and SDRAM.
The source command executes the specified GDB command file, therefore the SDRAM debug
configuration is identical to the SRAM one except for two differences:
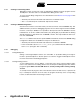
• The binary file selected in the “Main” tab must be the one linked for SDRAM
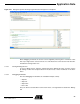
• In the “Commands” tab, the source init_sdram.gdb command must be added right
before load (among the ‘Run’ commands)
5.3.5 Debugging
5.3.5.1 Setting Breakpoints
Setting or removing breakpoints is done as in other IDEs, i.e. by double-clicking on the right of
the line to put the breakpoint on. Another option is to select the “Toggle Line Breakpoint” item of
the “Run” menu when in the Debug perspective.
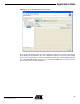
5.3.5.2 Starting a Debug Session
To start a debug session, choose “Debug...” in the “Run” menu. Then, select the debug configu-
ration to use and click on the “Debug” button. This should open the Debug perspective, with the
program stopped. Make sure that GDB Server is actually running before starting a debug
session.
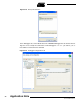
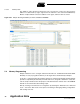
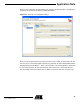
To actually execute the program, click on the “Resume” item in the “Run” menu, or press the F8
key. If a breakpoint has been set in the code, the program should stop at the corresponding
location, as demonstrated in the following screenshot: