
User guide


DEFINITY Performance Management User Guide, Release 2.0, 585-229-808
7 Administer Reports
Set up Report in Chart Format
Issue 1
November 1998
Page 160
6
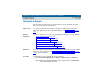
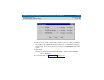
Optionally, click the Use Aggregator field to select another key field, also
called an aggregator field. If you use an aggregator, you can only choose one
field for the Y axis. If you do not use an aggregator, you can choose up to 10
Y-axis series as listed in the Y Axis Series field.
For example, you could plot the date and time on the X axis of a line graph,
and click Use Aggregator for a managed node (DEFINITY switch). The chart
would create a Y series for each managed node selected. See the sample
following this table.
• If you click the Use Aggregator field, select an aggregator field from the
selection list in the Aggregator field.
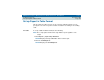
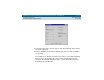
7 In the X axis field, select a key field to plot on the horizontal axis. For
example, this can be a record identifier, a managed node name, or a trunk
group ID. The X axis contains the key fields selected on the
Data Fields tab on
the Report Definition pane.
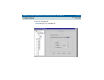
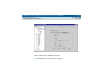
8 To use 3-dimensional (3D) effects, set the elevation and rotation to determine
the apparent position of the viewer:
• Set the elevation as high as 45 degrees to show a 3D graph as it would
appear from above.
• Set the 3D depth as a percent of the chart width.
• Set the rotation to show the graph from right or left.
9 Click Close.
Result:
The Report Definition pane reappears.
10 Click Save to save the settings.