
User guide


DEFINITY Performance Management User Guide, Release 2.0, 585-229-808
7 Administer Reports
Set up Report in Chart Format
Issue 1
November 1998
Page 159
4
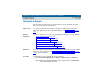
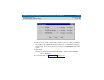
In the Chart Type field, select the type of chart: line graph, bar chart, stacked
bar chart, or pie chart.
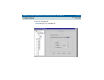
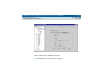
5 Click the Normalize X Axis field to eliminate gaps where no data is available
for reporting.
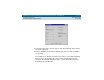
For example, if you plot time along the X axis and you collect data only during
business hours, there will be gaps on the chart for nights and weekends.
Clicking in this field will eliminate the gaps, so that 6 pm Friday is followed
immediately by 8 am Monday.