DEFINITY® Performance Management Release 2.
DEFINITY Performance Management User Guide, Release 2.
DEFINITY Performance Management User Guide, Release 2.
DEFINITY Performance Management User Guide, Release 2.
DEFINITY Performance Management User Guide, Release 2.
DEFINITY Performance Management User Guide, Release 2.
DEFINITY Performance Management User Guide, Release 2.
DEFINITY Performance Management User Guide, Release 2.
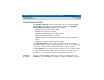
DEFINITY Performance Management User Guide, Release 2.0, 585-229-808 About This Book Introduction Issue 1 November 1998 Page 9 Introduction This chapter contains helpful information about the documentation and the Lucent resources available to customers for the DEFINITY Network Management Release 2.
DEFINITY Performance Management User Guide, Release 2.0, 585-229-808 About This Book User Document Set Issue 1 November 1998 Page 10 User Document Set The User Document Set for Release 2.0 is delivered on a separate CD-ROM. The CD-ROM contains all the installation and user guides for the DEFINITY Network Management Release 2.
DEFINITY Performance Management User Guide, Release 2.0, 585-229-808 About This Book DEFINITY Performance Management User Guide Main Menu Issue 1 November 1998 Page 11 After you install the guides, you can access the books from the Main Menu. The Introduction section on the Main Menu contains procedures for navigating between the books and searching for specific information. The Comments section contains an evaluation form.
DEFINITY Performance Management User Guide, Release 2.
DEFINITY Performance Management User Guide, Release 2.0, 585-229-808 About This Book Format Conventions Issue 1 November 1998 Page 13 Format Conventions The format conventions used in this book are visual cues to help users identify the type of action they should take to execute the steps in the procedures. The use of the format conventions are consistent throughout all the books in the User Document Set for this release. Table 1.
DEFINITY Performance Management User Guide, Release 2.0, 585-229-808 About This Book Format Conventions Issue 1 November 1998 Page 14 Table 1. Format Conventions Convention Description [Bold text in brackets] Indicates that you should type discrete data that is specific to your system, without the brackets.
DEFINITY Performance Management User Guide, Release 2.0, 585-229-808 About This Book Format Conventions Issue 1 November 1998 Page 15 Table 1. Format Conventions Convention Description Series of Menu Options The greater than (>) symbol indicates that your should select an option from a series of menus. File > Save For example, Click File > Save means that you should: • Click on the first menu (File). • Then click on the second option (Save) from the second menu.
DEFINITY Performance Management User Guide, Release 2.0, 585-229-808 About This Book Format Conventions Issue 1 November 1998 Page 16 Table 1. Format Conventions Convention Description Result paragraph Describes the result of an action taken in a step, as described in the following example: Result: The system displays the MAIN MENU. A results paragraph may also contain a message or a prompt in constant width font. A prompt sets up the action to be taken in the next step.
DEFINITY Performance Management User Guide, Release 2.0, 585-229-808 About This Book Lucent Resources Issue 1 November 1998 Page 17 Lucent Resources Lucent Technologies provides customers with a variety of planning, consulting, and technical services. The account executives are the customers’ primary source to obtain information and explore custom options to meet the customers’ specific business needs. The sections below briefly describe the services that are available to customers.
DEFINITY Performance Management User Guide, Release 2.0, 585-229-808 About This Book Technical Support Center (TSC) Issue 1 November 1998 Page 18 • Installation schedule and responsibilities • Platform acceptance test • Post installation verification and acceptance The Provisioning Package also contains detailed explanations of the three (3) implementation options that are available to customers: 1 Customer installation of the NMS platform and DEFINITY Network Management products.
DEFINITY Performance Management User Guide, Release 2.0, 585-229-808 About This Book NetCare Network Consulting Group Issue 1 November 1998 Page 19 Both the customer and TSC perform the Post Installation Verification and Acceptance Test of Performance Management. Time and materials charges If customers choose to install the DEFINITY Network Management products themselves, then the TSC is not responsible for the installation of the product software.
DEFINITY Performance Management User Guide, Release 2.0, 585-229-808 About This Book Year 2000 Compliance Issue 1 November 1998 Page 20 Year 2000 Compliance The Business Communication System (BSC) part of Lucent Technologies makes the following statement with respect to any product manufactured and sold by Lucent BCS in connection with a product’s operation in the year 2000.
DEFINITY Performance Management User Guide, Release 2.
DEFINITY Performance Management User Guide, Release 2.0, 585-229-808 1 NMS Overview Introduction Issue 1 November 1998 Page 22 Introduction The Network Management System (NMS), and the DEFINITY Proxy Agent, along with DEFINITY Performance Management, facilitate centralized management of DEFINITY systems. To maintain this centralized management, Performance Management complies with Simple Network Management Protocol (SNMP).
DEFINITY Performance Management User Guide, Release 2.0, 585-229-808 1 NMS Overview Introduction NMS Submaps Issue 1 November 1998 Page 23 On these maps, the NMS creates icons that represent managed nodes and Proxy Agents and also creates lines to represent connections between each Proxy Agent and its associated managed nodes. The NMS has the capability to produce three different submap options to depict a DEFINITY system.
DEFINITY Performance Management User Guide, Release 2.0, 585-229-808 1 NMS Overview System Requirements Issue 1 November 1998 Page 24 System Requirements Introduction The Project Provisioning Package for this release contains the specific recommendations and specifications to plan and install the Performance Management software.
DEFINITY Performance Management User Guide, Release 2.0, 585-229-808 1 NMS Overview System Requirements Issue 1 November 1998 Page 25 Supported Systems Release 2.0 of Performance Management only supports DEFINITY G3 PBX releases G3V4 through DEFINITY ECS release R6 Network Management Products The DEFINITY Performance Management 2.0 product only supports the network management products listed below: • DEFINITY Proxy Agent 2.0 • DEFINITY Fault Management 2.
DEFINITY Performance Management User Guide, Release 2.0, 585-229-808 1 NMS Overview NMS Capabilities Issue 1 November 1998 Page 26 NMS Capabilities Introduction The Network Management System (NMS) provides an overall view of DEFINITY systems. The NMS platform that Performance Management uses is OpenView. This section contains brief descriptions of the chapters that discuss NMS capabilities.
DEFINITY Performance Management User Guide, Release 2.0, 585-229-808 1 NMS Overview NMS Command Procedures Issue 1 November 1998 Page 27 NMS Command Procedures Introduction Each icon or connection line on an NMS submap provides access to information about managed nodes or connections.
DEFINITY Performance Management User Guide, Release 2.0, 585-229-808 1 NMS Overview Access the NMS Access the NMS To access the NMS, do the following: 1 Log in to NMS. 2 At a UNIX editor prompt, type $OV_BIN/ovw& and press Enter. Result: The system opens the NMS application 3 Double-click a DEFINITY icon. Result: The system opens a DEFINITY submap.
DEFINITY Performance Management User Guide, Release 2.0, 585-229-808 1 NMS Overview Screen Components Issue 1 November 1998 Page 29 Screen Components The following example is a generic submap with screen components that display on any submap. 2 1 5 3 4 1 Platform-specific Menu Bar 4 Managed Node Icon 2 Application Alert Event Log 5 Connection Line 3 Proxy Agent Icon Figure 1.
DEFINITY Performance Management User Guide, Release 2.0, 585-229-808 1 NMS Overview Screen Components Menu Bar Issue 1 November 1998 Page 30 To access submenus for DEFINITY equipment, click a DEFINITY managed node icon. Then, click Performance > DEFINITY Result: The system displays the DEFINITY submenu. The selections that are available on this submenu vary based upon the graphical element you selected. Items that are not available display in grey.
DEFINITY Performance Management User Guide, Release 2.0, 585-229-808 1 NMS Overview Screen Components Proxy Agent Icon Issue 1 November 1998 Page 31 When you select a Proxy Agent Icon, DEFINITY submenu options reflect commands that are available for that Proxy Agent. You can also double-click the Proxy Agent icon to initiate a telnet session to the Proxy Agent application. You can also select the Proxy Agent Icon.
DEFINITY Performance Management User Guide, Release 2.0, 585-229-808 1 NMS Overview Exit from the NMS Exit from the NMS To exit from the NMS, complete the following steps: 1 Close all programs associated with the NMS. 2 At the main window, click Map > Exit. Result: The system closes the NMS application.
DEFINITY Performance Management User Guide, Release 2.
DEFINITY Performance Management User Guide, Release 2.0, 585-229-808 2 NMS Submap Administration Introduction Issue 1 November 1998 Page 34 Introduction The Network Management System (NMS) provides graphical user interface (GUI) capabilities that allow you to view alarms for Proxy Agents and alerts for managed nodes. You can view the connection status between Proxy Agents and their associated managed nodes. The NMS creates three network submaps to display this information.
DEFINITY Performance Management User Guide, Release 2.
DEFINITY Performance Management User Guide, Release 2.0, 585-229-808 2 NMS Submap Administration Set Auto-Discovery Passwords Issue 1 November 1998 Page 36 Set Auto-Discovery Passwords The default installation setting for Fault Management grants access to Auto-Discovery for all users. Users who have access to Auto-Discovery can modify NMS read/write submaps. If you wish to restrict Auto-Discovery access, you must assign Auto-Discovery passwords.
DEFINITY Performance Management User Guide, Release 2.0, 585-229-808 2 NMS Submap Administration Set Auto-Discovery Passwords Issue 1 November 1998 Page 37 ! SECURITY ALERT: Unauthorized users who attempt to access Auto-Discovery receive a message in the Application Alert Event Log that provides authorization status for each user. The NMS displays the Application Alert Event Log on all NMS screens.
DEFINITY Performance Management User Guide, Release 2.0, 585-229-808 2 NMS Submap Administration Set up Auto-Discovery Issue 1 November 1998 Page 38 Set up Auto-Discovery To set up NMS submaps, you must activate Auto-Discovery. Activating Auto-Discovery allows the NMS to create submaps from information that was transmitted from Proxy Agents. Setting up Auto-Discovery on a public network differs from the process of setting up Auto-Discovery on a private network.
DEFINITY Performance Management User Guide, Release 2.0, 585-229-808 2 NMS Submap Administration Set up Auto-Discovery Private Networks Issue 1 November 1998 Page 39 If you have a private network, you must complete the following steps to ensure that the Proxy Agent and NMS can communicate effectively. The entries you type in the NMS must exactly match the entries that you typed in the Proxy Agent. 1 From the menu bar in the Network Management System, click Options > SNMP Configuration.
DEFINITY Performance Management User Guide, Release 2.0, 585-229-808 2 NMS Submap Administration Select Network Submap Issue 1 November 1998 Page 40 Select Network Submap The NMS provides three submap options that allow you to organize your DEFINITY system in three different ways. You can organize your DEFINITY systems in the following ways: Note: For information on modifying submaps and the Location File, go to "Modify NMS Submaps" on page 61. NMS Submap Options • Generic submap.
DEFINITY Performance Management User Guide, Release 2.0, 585-229-808 2 NMS Submap Administration Select Network Submap Root Level Icons Issue 1 November 1998 Page 41 The system displays the Root map when you log in to the NMS. Icons representing NMS submaps display on this screen. The example below shows DEFINITY submap icons that appear on the Root map. Figure 3.
DEFINITY Performance Management User Guide, Release 2.0, 585-229-808 2 NMS Submap Administration Generic Submap Issue 1 November 1998 Page 42 Generic Submap The generic submap uses a point-to-point layout to display an overview of all Proxy Agents and their associated managed nodes. The generic submap icon resides on the open map and at the root level of the NMS. You double-click the DEFINITY generic submap icon on the Root map to open the DEFINITY submap shown below. Figure 4.
DEFINITY Performance Management User Guide, Release 2.0, 585-229-808 2 NMS Submap Administration USA Submap Issue 1 November 1998 Page 43 USA Submap The USA submap allows you to view your DEFINITY system by geographic location. Managed nodes and Proxy Agent objects appear on the state that you administered in the Proxy Agent.
DEFINITY Performance Management User Guide, Release 2.0, 585-229-808 2 NMS Submap Administration USA Submap State submap Issue 1 November 1998 Page 44 You double-click a managed node icon on a USA submap to display a state submap similar to the map shown below. Figure 6.
DEFINITY Performance Management User Guide, Release 2.0, 585-229-808 2 NMS Submap Administration Custom Submap Issue 1 November 1998 Page 45 Custom Submap Custom submaps allow you to manage the DEFINITY system at a more specific level than the other submaps. For example, you can organize information according to business territories or according to the type of DEFINITY systems that you manage.
DEFINITY Performance Management User Guide, Release 2.0, 585-229-808 2 NMS Submap Administration Custom Submap Figure 7.
DEFINITY Performance Management User Guide, Release 2.0, 585-229-808 2 NMS Submap Administration Connections Issue 1 November 1998 Page 47 Connections Introduction The NMS allows you to view two types of connections and to view the status of each connection. The two types of connections that you can administer are: static or dynamic. The status of each of these connections reflects the activity of that connection.
DEFINITY Performance Management User Guide, Release 2.0, 585-229-808 2 NMS Submap Administration View Types of Connections Issue 1 November 1998 Page 48 View Types of Connections To view connection types, you must go to a DEFINITY submap. At the submap, you will see one of the following types of connections: . Connection types Figure 8. Sample OpenView 5.0 static connection Figure 9. Sample OpenView 5.0 dynamic connection Figure 10. Sample OpenView 4.11 static connection Figure 11.
DEFINITY Performance Management User Guide, Release 2.0, 585-229-808 2 NMS Submap Administration View Types of Connections Static connections Issue 1 November 1998 Page 49 A static connection maintains a continuous communication link between the Proxy Agent and the managed node. We recommend that you select the static connection to monitor critical managed nodes for 24 hours per day, 7 days per week.
DEFINITY Performance Management User Guide, Release 2.0, 585-229-808 2 NMS Submap Administration Identify Connection Status Issue 1 November 1998 Page 50 Identify Connection Status Each connection line appears in one of six colors that represent the six status options for connections. If you do not wish to use the system default colors, you may assign a custom color by modifying values in the $APP_DEF/OVw file. The table below describes connection status. Table 2.
DEFINITY Performance Management User Guide, Release 2.0, 585-229-808 2 NMS Submap Administration Identify Connection Status Connect a Managed Node Issue 1 November 1998 Page 51 OpenView allows you to establish connections between a Proxy Agent and a managed node with the following steps: 1 Click on the line that represents a connection between a Proxy Agent and a managed node.
DEFINITY Performance Management User Guide, Release 2.0, 585-229-808 2 NMS Submap Administration Identify Connection Status Disconnect a Managed Node Issue 1 November 1998 Page 52 OpenView also allows you to disable a managed node from a Proxy Agent. ! CAUTION: If you disable a managed node, you place it in a status of off. To use this connection in the future, you must enable the connection on the Proxy Agent or start the connection.
DEFINITY Performance Management User Guide, Release 2.0, 585-229-808 2 NMS Submap Administration View the Status of a Connection Issue 1 November 1998 Page 53 View the Status of a Connection During any active NMS session, you can access details about a selected connection. To view details about a connection available on the Connection Status screen, do the following: 1 Click the line that represents a connection between a Proxy Agent and a managed node.
DEFINITY Performance Management User Guide, Release 2.0, 585-229-808 2 NMS Submap Administration View the Status of a Connection Example: Connection Status screen Issue 1 November 1998 Page 54 The information you can view on a Connection Status screen is similar to the example shown below.
DEFINITY Performance Management User Guide, Release 2.0, 585-229-808 2 NMS Submap Administration View the Status of a Connection Field Description Issue 1 November 1998 Page 55 The following table provides descriptions for the connection details available on the Connection Status screen. Table 3. Field descriptions for Connection Status screen Field Description Connection Status Identifies the selected status for the connection. The connection status can be: init, up, down, off, idle, or other.
DEFINITY Performance Management User Guide, Release 2.0, 585-229-808 2 NMS Submap Administration Verify Static Connection Status Issue 1 November 1998 Page 56 Table 3. Field descriptions for Connection Status screen Field Description Data Responses The number of times a managed node responds to a data request from a Proxy Agent. Alarm Forwarding Status Displays ok if the alarm status transmitted successfully. Displays failed if the alarm status did not transmit successfully.
DEFINITY Performance Management User Guide, Release 2.0, 585-229-808 2 NMS Submap Administration Verify Static Connection Status Open a Managed Node List screen Issue 1 November 1998 Page 57 You can display a screen that lists all managed nodes that connect to a Proxy Agent. This list contains the connection status for each managed node. To open a managed node list, do the following: 1 Select a Proxy Agent icon from the network submap.
DEFINITY Performance Management User Guide, Release 2.0, 585-229-808 2 NMS Submap Administration Verify Static Connection Status Example: Managed Node List screen Issue 1 November 1998 Page 58 When you open a managed node list, you will see a screen similar to the Managed Node List for Proxy Agent below. Figure 13.
DEFINITY Performance Management User Guide, Release 2.0, 585-229-808 2 NMS Submap Administration Verify Static Connection Status Field Descriptions Issue 1 November 1998 Page 59 The table below contains field descriptions for the Managed Node List for Proxy Agent screen shown above. Table 4. Field descriptions for Managed Node List for Proxy Agent screen Field Description Example Type The type of switch (ECS, G3, MCU). ECS Node Name The managed node name as administered in the Proxy Agent.
DEFINITY Performance Management User Guide, Release 2.0, 585-229-808 2 NMS Submap Administration Verify Static Connection Status Issue 1 November 1998 Page 60 Table 4. Field descriptions for Managed Node List for Proxy Agent screen Field Description Example Submap Location The type of submap associated with either the USA or Custom submap 123456789 0 Object Label The system name of the managed node. The object snmplab2 label does not need to match the name administered in the Proxy Agent.
DEFINITY Performance Management User Guide, Release 2.0, 585-229-808 2 NMS Submap Administration Modify NMS Submaps Issue 1 November 1998 Page 61 Modify NMS Submaps If you wish to modify location or connection information for a submap, you can edit the Location Override file from a text editor or can modifying the Default Location screen on the Proxy Agent. Modify the Location Override File In the Location Override file, you can change location information for managed nodes or hide managed nodes.
DEFINITY Performance Management User Guide, Release 2.
DEFINITY Performance Management User Guide, Release 2.0, 585-229-808 3 NMS Alerts Introduction Issue 1 November 1998 Page 63 Introduction The Network Management System When Performance Management performs a data collection, or when the Network Management System (NMS) performs a poll, the NMS color-codes managed node icons to identify alerts for those managed nodes.
DEFINITY Performance Management User Guide, Release 2.0, 585-229-808 3 NMS Alerts Identify NMS Alerts Issue 1 November 1998 Page 64 Identify NMS Alerts Introduction When a Proxy Agent has an alarm or a managed node has an alert, the NMS colors the corresponding icon to indicate the severity of the alarm or alert. When multiple alarms or alerts that have more than one level of severity occur, icon colors represent the most severe alarm or alert. See "Icon States" on page 56 for details on icon states.
DEFINITY Performance Management User Guide, Release 2.0, 585-229-808 3 NMS Alerts Identify NMS Alerts Identify Proxy Agent Icon States Issue 1 November 1998 Page 65 Proxy Agent alarms occur when alarm forwarding fails or when an authentication failure occurs. Because alarms manifest as colored icons, the following section refers to alarm states as icon states. Each state of a Proxy Agent icon represents a condition that exists between a Proxy Agent and a managed node.
DEFINITY Performance Management User Guide, Release 2.0, 585-229-808 3 NMS Alerts Identify NMS Alerts Events that Change Proxy Agent States Issue 1 November 1998 Page 66 The color of a Proxy Agent icon changes when polling events or trap events indicate a change in the Proxy Agent alarm status. Proxy Agent icon states change when OpenView polls a Proxy Agent and receives one of the unacceptable results identified in the table below. Table 6.
DEFINITY Performance Management User Guide, Release 2.0, 585-229-808 3 NMS Alerts Identify NMS Alerts Identify Managed Node Icon States Issue 1 November 1998 Page 67 Managed node alerts arise when unacceptable conditions occur on a managed node. Because alerts manifest as color-coded icons, the following section refers to alert states as icon states. The state of a managed node icon represents the current alert for that managed node. The NMS platform assigns the names of these states.
DEFINITY Performance Management User Guide, Release 2.0, 585-229-808 3 NMS Alerts Identify NMS Alerts Issue 1 November 1998 Page 68 Table 7. Managed node icon alert states OpenView State Name Definition Major The managed node has at least one major alert. Unknown One of the following conditions is true: • Communication between a Proxy Agent and a managed node is unstable; therefore, the Proxy Agent cannot indicate the status or health of the managed node.
Issue 1 November 1998 Page 69 DEFINITY Performance Management User Guide, Release 2.0, 585-229-808 3 NMS Alerts Identify NMS Alerts Events that Change Managed Node Icon States The color of a managed node icon changes when Performance Management conducts a data collection that identifies an alert level. Below is a description of the alert levels you might encounter. Data Collection. Performance Management collects data on a user-specified basis.
Issue 1 November 1998 Page 70 DEFINITY Performance Management User Guide, Release 2.0, 585-229-808 3 NMS Alerts Identify NMS Alerts Table 8.
DEFINITY Performance Management User Guide, Release 2.0, 585-229-808 3 NMS Alerts NMS alert Notification Methods Issue 1 November 1998 Page 71 NMS alert Notification Methods Introduction The Performance Management installation process allows you to install a script that forwards alert information to a pager or to email. You can also install add-on software such as TelAlert or Remedy that provide additional methods for notifying you when alerts occur.
DEFINITY Performance Management User Guide, Release 2.0, 585-229-808 3 NMS Alerts NMS alert Notification Methods Issue 1 November 1998 Page 72 Table 9. NMS alert Notification Methods Software Notification Type Description TelAlert Voice Page Sends a voice page to the system administrator and sends a code that identifies the alert. The voice page also confirms that the system administrator received the page. The page repeats until the system administrator responds to the page.
DEFINITY Performance Management User Guide, Release 2.0, 585-229-808 3 NMS Alerts NMS alert Notification Methods Set Up Alert Notification Issue 1 November 1998 Page 73 To setup alert notification, identify the notification method that meets your business needs, then complete the following procedure. 1 Select an Alert Notification method. 2 At a UNIX editor, type the following and press ENTER: /opt/OV/OneVision/bin/Samples Result: The system displays a list of script files.
DEFINITY Performance Management User Guide, Release 2.
DEFINITY Performance Management User Guide, Release 2.0, 585-229-808 4 Performance Management Overview Introduction Issue 1 November 1998 Page 75 Introduction As one of a collection of Business Communication System (BCS) management applications, the Performance Management system enables you to monitor the performance of the managed nodes (DEFINITY switch) in your DEFINITY system using an industry standard SNMP-based Network Management System (NMS).
DEFINITY Performance Management User Guide, Release 2.0, 585-229-808 4 Performance Management Overview Introduction Issue 1 November 1998 Page 76 • Report schedule Where you specify when a report should run, either immediately or at a later scheduled time. • Alerting Icons on the screen that indicate any violations of exception thresholds or alerts, such as when the system fails to collect performance data as scheduled, or when the system fails to generate a scheduled report.
DEFINITY Performance Management User Guide, Release 2.0, 585-229-808 4 Performance Management Overview System Requirements Issue 1 November 1998 Page 77 System Requirements The Project Provisioning Package for this release contains the specific recommendations and specifications to plan and install the Performance Management software.
DEFINITY Performance Management User Guide, Release 2.0, 585-229-808 4 Performance Management Overview Supported Products Issue 1 November 1998 Page 78 Supported Products NMS Products The DEFINITY Performance Management 2.0 product supports the following network management products: • DEFINITY Proxy Agent 2.0 • DEFINITY Fault Management 2.0 NMS Platforms The DEFINITY Performance Management 2.0 product supports the following Network Management System (NMS) platforms: • HP OpenView Releases 4.11, 5.
DEFINITY Performance Management User Guide, Release 2.0, 585-229-808 4 Performance Management Overview Access Performance Management Issue 1 November 1998 Page 79 Access Performance Management You should start Performance Management after you complete the installation process to verify that Performance Management is installed correctly. Procedure To access Performance Management, do the following: 1 Log in to UNIX. 2 Start the operating system software.
DEFINITY Performance Management User Guide, Release 2.0, 585-229-808 4 Performance Management Overview Access Performance Management Issue 1 November 1998 Page 80 6 If the system displays this screen, click Start Performance Management. Result: The Performance Management application starts and displays the Performance Management main window.
DEFINITY Performance Management User Guide, Release 2.0, 585-229-808 4 Performance Management Overview Exit Performance Management Issue 1 November 1998 Page 81 Exit Performance Management To exit Performance Management, do one of the following: • Click File > Exit from the main window of Performance Management • Exit the NMS session The system closes Performance Management and any associated open windows.
DEFINITY Performance Management User Guide, Release 2.
DEFINITY Performance Management User Guide, Release 2.0, 585-229-808 5 Basic Screen Components Introduction Issue 1 November 1998 Page 83 Introduction Performance Management uses a graphical user interface (GUI) as a way to access the tasks you need to perform in order to measure system performance. The GUI consists of various screens, buttons, and other navigational tools, in conjunction with your mouse, to enable you to access all of the reporting capabilities the system provides.
DEFINITY Performance Management User Guide, Release 2.0, 585-229-808 5 Basic Screen Components Screen Components Issue 1 November 1998 Page 84 Screen Components The following sample screen shows the basic screen components of the main window of the Performance Management application. See the table following the screen for a description of each component.
DEFINITY Performance Management User Guide, Release 2.0, 585-229-808 5 Basic Screen Components Screen Components .
DEFINITY Performance Management User Guide, Release 2.0, 585-229-808 5 Basic Screen Components Screen Components Component Description Component Name Description Menu bar Displays pull-down menus for performing basic tasks. Go to "Menu bar" on page 92 for more details. Master Event Log Displays the Master Event Log pane, which shows all events for all managed nodes. Go to Chapter 8, "Event Log" for more details. Performance Management Displays three nodes for managing the performance of the system.
DEFINITY Performance Management User Guide, Release 2.0, 585-229-808 5 Basic Screen Components Screen Components Component Name Description Command buttons Buttons that are common on all screens. Go to "Command Buttons" on page 97 for more details. Status bar Indicates the status of the system. Go to "Status Bar" on page 98 for more details. Left pane The left part of the main window that contains icons and nodes. Go to "Main Window" on page 88 for more details.
DEFINITY Performance Management User Guide, Release 2.0, 585-229-808 5 Basic Screen Components Main Window Issue 1 November 1998 Page 88 Main Window The main window is the initial screen you see when you access Performance Management. The main window has the same look and feel as the Microsoft Windows Explorer tree, where there are two sides to the screen, a left (pane) and a right side (pane).
DEFINITY Performance Management User Guide, Release 2.
DEFINITY Performance Management User Guide, Release 2.0, 585-229-808 5 Basic Screen Components About Panes Issue 1 November 1998 Page 90 About Panes Depending on what you select in the left pane, the right side of the main window (the right pane) can display any of the following specific panes. These panes and examples are described in more detail in the rest of this document as part of the description of the task they correspond to.
DEFINITY Performance Management User Guide, Release 2.0, 585-229-808 5 Basic Screen Components About Panes Issue 1 November 1998 Page 91 Pane Description DEFINITY Systems Contains a node for each managed node known by Performance Management. DEFINITY Contains nodes for setting thresholds to measure the performance of a specific managed node. Data Collection Contains nodes for defining data collection parameters for a managed node.
DEFINITY Performance Management User Guide, Release 2.0, 585-229-808 5 Basic Screen Components Menu bar Issue 1 November 1998 Page 92 Menu bar The options available through the pfmenu bar are described as follows: Menu Option Description File New Creates a new component as appropriate for the task being performed. Expand Expands the selected node on the pane. Up One Level Displays the parent of the selected node.
DEFINITY Performance Management User Guide, Release 2.0, 585-229-808 5 Basic Screen Components Menu bar Issue 1 November 1998 Page 93 Menu Option Description Help Topics NA Current Panel Online help for the currently-displayed pane About Definity Performance Management 2.
DEFINITY Performance Management User Guide, Release 2.0, 585-229-808 5 Basic Screen Components Nodes Issue 1 November 1998 Page 94 Nodes Nodes represent the options available in your system. There are three basic nodes available from the Root pane. The Root pane is the starting point for performing all Performance Management tasks, since all other nodes branch off from these three nodes.
DEFINITY Performance Management User Guide, Release 2.0, 585-229-808 5 Basic Screen Components Alert Indicators Issue 1 November 1998 Page 95 Alert Indicators Alert indicators are visual cues of any problems in the DEFINITY system. Alerting is also used by the NMS to indicate any problems associated with a specific managed node. There are different levels of alerts that have corresponding warnings, as indicated by the shape and color of the alert indicator.
DEFINITY Performance Management User Guide, Release 2.
DEFINITY Performance Management User Guide, Release 2.0, 585-229-808 5 Basic Screen Components Managed Nodes Issue 1 November 1998 Page 97 Managed Nodes Expanding the DEFINITY Systems node by clicking on it displays all of the nodes for each switch, or managed node, known by the Performance Management system. Command Buttons The command buttons that appear at the bottom of the right pane do the following: Button Purpose Save Updates the database with the current settings.
DEFINITY Performance Management User Guide, Release 2.0, 585-229-808 5 Basic Screen Components Status Bar Issue 1 November 1998 Page 98 Status Bar This is a message area at the bottom of the main window. Depending on the circumstances, it displays a status indicator for any processing that lasts more than two seconds. Splitter Bar The splitter bar separates the right and left panes. To change the size of either pane, drag the splitter bar that separates the two sides until the desired size is displayed.
DEFINITY Performance Management User Guide, Release 2.
DEFINITY Performance Management User Guide, Release 2.0, 585-229-808 6 Specify Collection Parameters Introduction Issue 1 November 1998 Page 100 Introduction One of the features of Performance Management is the ability to track the performance of a managed node through reports you can generate for various aspects of the system. In order to run reports that help track the system, you must first specify the data to collect for those reports.
DEFINITY Performance Management User Guide, Release 2.0, 585-229-808 6 Specify Collection Parameters Specify Default Data Collection Hours Issue 1 November 1998 Page 101 Specify Default Data Collection Hours Introduction This procedure describes how to specify the default days and times Performance Management should collect data for the entire Performance Management system.
DEFINITY Performance Management User Guide, Release 2.0, 585-229-808 6 Specify Collection Parameters Specify Default Data Collection Hours Issue 1 November 1998 Page 102 2 Do any of the following: • To turn the collection on, put a checkmark in the On box next to the appropriate days of the week by clicking in the box. To turn the collection off, remove the checkmark by clicking on the box that has the checkmark for the appropriate days of the week.
DEFINITY Performance Management User Guide, Release 2.0, 585-229-808 6 Specify Collection Parameters Specify Default Data Collection Hours Issue 1 November 1998 Page 103 Note: Since collection times are hourly, you cannot specify minutes. 3 Click Save to save the settings, or make changes to each tab as necessary and then click Save.
DEFINITY Performance Management User Guide, Release 2.0, 585-229-808 6 Specify Collection Parameters Specify Collection Hours for a Specific Managed Node Issue 1 November 1998 Page 104 Specify Collection Hours for a Specific Managed Node Introduction This procedure describes how to specify what days and times Performance Management should collect data for a specific managed node. Once you specify collection hours for a specific managed node, those are the current values until changed.
DEFINITY Performance Management User Guide, Release 2.0, 585-229-808 6 Specify Collection Parameters Specify Collection Hours for a Specific Managed Node Issue 1 November 1998 Page 105 2 Do you want to collect data for this managed node? • If yes, put a checkmark in the box next to the Collection on field by clicking Collection on. • If no, leave the box blank.
DEFINITY Performance Management User Guide, Release 2.0, 585-229-808 6 Specify Collection Parameters Specify Collection Hours for a Specific Managed Node Issue 1 November 1998 Page 106 3 Do one of the following: • To use the default values set up for the entire DEFINITY system, click Use default values. You cannot change any of the collection values if this option is selected. • To specify specific collection values for this managed node, click Use custom values.
DEFINITY Performance Management User Guide, Release 2.0, 585-229-808 6 Specify Collection Parameters Specify Default Data Types Issue 1 November 1998 Page 107 Specify Default Data Types Introduction This procedure describes how to specify the types of default data to collect for the entire Performance Management system.
DEFINITY Performance Management User Guide, Release 2.0, 585-229-808 6 Specify Collection Parameters Specify Default Data Types Issue 1 November 1998 Page 108 3 Put a check mark next to each data type you want to report on by clicking in the appropriate box. Note that for some data types you can also select peaks on an hourly, daily, or weekly basis. 4 Click Save to save the settings, or make changes to each tab as necessary and then click Save.
DEFINITY Performance Management User Guide, Release 2.0, 585-229-808 6 Specify Collection Parameters Specify Data Types for a Specific Managed Node Issue 1 November 1998 Page 109 Specify Data Types for a Specific Managed Node Introduction This procedure describes how to specify the data types to collect for a specific managed node.
DEFINITY Performance Management User Guide, Release 2.0, 585-229-808 6 Specify Collection Parameters Specify Data Types for a Specific Managed Node Issue 1 November 1998 Page 110 3 Do you want to collect data for this managed node? • If yes, click Collection on. • If no, leave the box blank. If you select no, you will not have any data to report on.
DEFINITY Performance Management User Guide, Release 2.0, 585-229-808 6 Specify Collection Parameters Specify Data Types for a Specific Managed Node Issue 1 November 1998 Page 111 4 Do one of the following: • To use the default values set up for the entire DEFINITY system, click Use default values. You cannot change any of the collection values if this option is selected. • To specify specific collection values for this managed node, click Use custom values.
DEFINITY Performance Management User Guide, Release 2.0, 585-229-808 6 Specify Collection Parameters Specify Default Data Storage Duration Issue 1 November 1998 Page 112 Specify Default Data Storage Duration Introduction This procedure describes how to specify system-wide default values for the length of time collected data should be stored. You can specify how long hourly, daily, and weekly data should be stored. Retrieve Stored Data To retrieve stored data, go to Chapter 7, "Administer Reports".
DEFINITY Performance Management User Guide, Release 2.0, 585-229-808 6 Specify Collection Parameters Specify Default Data Storage Duration Issue 1 November 1998 Page 113 3 Do any of the following: • To specify how many days to keep hourly data, enter the number of days in the Keep Hourly Data field. Maximum is six months. • To specify how many days to keep data for daily peaks, enter the number of days in the Keep Daily Peaks field. Maximum is two years.
DEFINITY Performance Management User Guide, Release 2.0, 585-229-808 6 Specify Collection Parameters Specify Default Data Storage Duration Issue 1 November 1998 Page 114 4 Click Save to save the settings, or make changes to each tab as necessary and then click Save.
DEFINITY Performance Management User Guide, Release 2.0, 585-229-808 6 Specify Collection Parameters Specify Data Storage Duration for a Specific Managed Node Issue 1 November 1998 Page 115 Specify Data Storage Duration for a Specific Managed Node Introduction This procedure describes how to specify how long collected data should be stored for a specific managed node. You can specify how long hourly, daily, and weekly data should be stored.
DEFINITY Performance Management User Guide, Release 2.0, 585-229-808 6 Specify Collection Parameters Specify Data Storage Duration for a Specific Managed Node Issue 1 November 1998 Page 116 3 Do you want to collect data for this managed node? • If yes, put a checkmark in the box next to the Collection on field by clicking in it • If no, leave the box blank. 4 Click Use custom values and go to the next step to specify specific collection values for this managed node.
DEFINITY Performance Management User Guide, Release 2.0, 585-229-808 6 Specify Collection Parameters Specify Data Storage Duration for a Specific Managed Node Issue 1 November 1998 Page 117 5 Do any of the following: • For data types for which hourly data is collected, type the number of days to keep the data in the Keep Hourly Data field. Maximum is six months. • To specify how many days to keep data for daily peaks, type the number of days in the Keep Daily Peaks field. Maximum is two years.
DEFINITY Performance Management User Guide, Release 2.
DEFINITY Performance Management User Guide, Release 2.0, 585-229-808 7 Administer Reports Introduction Issue 1 November 1998 Page 119 Introduction The heart of the Performance Management system is the ability to produce reports on various performance aspects of the system.
DEFINITY Performance Management User Guide, Release 2.0, 585-229-808 7 Administer Reports Getting Started Issue 1 November 1998 Page 120 Getting Started Overview The following steps highlight the flow of tasks you need to perform in order to create, define, and store a Performance Management report. Task (in order) Described in...
DEFINITY Performance Management User Guide, Release 2.0, 585-229-808 7 Administer Reports Getting Started Report Definition Pane Issue 1 November 1998 Page 121 The Report Definition pane is the starting point for defining report parameters. The report name, report type, report definition tabs, and command buttons are always displayed on this pane.
DEFINITY Performance Management User Guide, Release 2.
DEFINITY Performance Management User Guide, Release 2.0, 585-229-808 7 Administer Reports Getting Started Command Buttons Issue 1 November 1998 Page 123 The four buttons that appear at the bottom of the Report Definition pane are available regardless of the tab you are in, and they all perform the same function for each tab, as described in the following table: Button Purpose Save Saves the current settings.
DEFINITY Performance Management User Guide, Release 2.0, 585-229-808 7 Administer Reports Create a New Report Issue 1 November 1998 Page 124 Create a New Report Procedure To create a new report, do the following: 1 Click the Reports node. Result: The Reports node is highlighted. 2 From the File menu on the Main Performance Management window, click File > New. Result: Displays a pop-up window for entering the report name. 3 Type the name of the report.
DEFINITY Performance Management User Guide, Release 2.0, 585-229-808 7 Administer Reports Create a New Report Issue 1 November 1998 Page 125 5 Click Run Now to run the report now. The report will print to the screen. If the report needs any changes, change the report definition parameters as listed in "Getting Started" on page 120. Result: Displays the report based on the current report definition parameters, as shown in the following example.
DEFINITY Performance Management User Guide, Release 2.0, 585-229-808 7 Administer Reports Define Data Fields Issue 1 November 1998 Page 126 Define Data Fields This procedure describes how to specify what data fields to include in the report. You can also specify the units of traffic intensity to include. About Secondary Data Fields Some report types can have secondary data fields.
DEFINITY Performance Management User Guide, Release 2.
DEFINITY Performance Management User Guide, Release 2.0, 585-229-808 7 Administer Reports Define Data Fields Issue 1 November 1998 Page 128 data fields for that report; the right part specifies units of traffic intensity. 2 The field at the top of the pane lists the report (data) type, or DEFINITY component. Select the report type to report on from the pull-down list by clicking in the box next to the appropriate report type.
DEFINITY Performance Management User Guide, Release 2.0, 585-229-808 7 Administer Reports Define Data Fields Issue 1 November 1998 Page 129 Note: Make sure that the data type you select here is also the data type that you are collecting data on as described in Chapter 6, "Specify Collection Parameters". The data selected here is also the data available when you set up the format in the Send Output tab. The data can also be one of the types that you have already collected data on.
DEFINITY Performance Management User Guide, Release 2.0, 585-229-808 7 Administer Reports Define Data Fields Issue 1 November 1998 Page 130 Result: Displays the report on your screen using the default report parameters. To make any changes, go to the next step. • To set up report parameters before running the report, click the Send Output tab and change any parameters as needed. Result: Displays the Send Output tab.
DEFINITY Performance Management User Guide, Release 2.0, 585-229-808 7 Administer Reports Options from a Displayed Report Issue 1 November 1998 Page 131 Options from a Displayed Report You have several options once you have a report displayed on your screen.
DEFINITY Performance Management User Guide, Release 2.0, 585-229-808 7 Administer Reports Options from a Displayed Report To... Do this Issue 1 November 1998 Page 132 Result Select primary Click Primary and select data or secondary from the list of options. data, if the Primary button displays. See "About Secondary Data Fields" on page 126 for secondary data field details. The data you select will appear in the report. Change the sort From the Tools menu, click Sort.
DEFINITY Performance Management User Guide, Release 2.0, 585-229-808 7 Administer Reports Options from a Displayed Report Issue 1 November 1998 Page 133 To... Do this Result Change the report format From the File menu, click Open > [Chart or Table]. If Chart is selected, displays Chart Properties window. Go to "Set up Report in Chart Format" on page 157 for more detail. If Table is selected, changes report output to a table using the sort values defined in the Send Output tab.
DEFINITY Performance Management User Guide, Release 2.0, 585-229-808 7 Administer Reports Print a Report Issue 1 November 1998 Page 134 Print a Report This procedure describes how to print so that the printed report will appear as it displays on the screen (as a report image) or in a tabular format. Although there are several ways to print a report, this procedure explains how to print a report so that the printed report looks just like it does on the screen.
DEFINITY Performance Management User Guide, Release 2.0, 585-229-808 7 Administer Reports Print a Report Issue 1 November 1998 Page 135 3 To define printer detail from the Print Dialog window, enter the settings as described in the following table and click Print. If necessary, consult with your UNIX system administrator for system-specific information. After you click Print, the report will print on the designated printer.
DEFINITY Performance Management User Guide, Release 2.0, 585-229-808 7 Administer Reports Print a Report Issue 1 November 1998 Page 136 Field Description Copies Number of printed copies. Printer For specifying a UNIX print command. For example, the following command will produce a PostScript output file: prt -d 30N68 -1 raw File For creating a postscript file, using UNIX conventions. Banner Page Title Specifies what will appear at the top of the page of the report.
DEFINITY Performance Management User Guide, Release 2.0, 585-229-808 7 Administer Reports Print a Report Issue 1 November 1998 Page 137 4 To define printer detail from the Print Properties window, change the settings as described in the following table and click Close. After you click Close, the report will print based on the UNIX print command you specify. These values are usually set up by your UNIX system administrator, but you can change them here.
DEFINITY Performance Management User Guide, Release 2.0, 585-229-808 7 Administer Reports Print a Report Field Description Print Command The UNIX print command the system will use to print the report. Page Width The width of the report. The default is 72 characters for portrait mode. Page Height The height of the report. The default is 66 characters for portrait mode.
DEFINITY Performance Management User Guide, Release 2.0, 585-229-808 7 Administer Reports Select Managed Nodes Issue 1 November 1998 Page 139 Select Managed Nodes This procedure describes how to select which managed nodes in the Network Management System you want to report on. If the managed nodes have any corresponding components, you can also select which components of each system to report on.
DEFINITY Performance Management User Guide, Release 2.0, 585-229-808 7 Administer Reports Select Managed Nodes Issue 1 November 1998 Page 140 3 In the Select DEFINITY systems box, put a checkmark in the box next to each DEFINITY system you want to report on. The default is all systems. You can choose any combination, but at least one system is required.
DEFINITY Performance Management User Guide, Release 2.0, 585-229-808 7 Administer Reports Select Managed Nodes Issue 1 November 1998 Page 141 Result: If the managed node you checked has individual components, a list of those components displays in the right side of the pane. See the table following this procedure for a list of report types and corresponding components. 4 For each system selected, are there any components listed in the right side of the pane? • If yes, go to the next step.
Issue 1 November 1998 Page 142 DEFINITY Performance Management User Guide, Release 2.0, 585-229-808 7 Administer Reports Select Managed Nodes button. If you choose this option, a list of any predefined trunk group lists will display. See "Create and Modify a Trunk Group List" on page 143 for trunk group list details. 7 Click Save to save the settings. Report Type and The expanded component selection list shows each component identifier with the Component List name of its managed node.
DEFINITY Performance Management User Guide, Release 2.0, 585-229-808 7 Administer Reports Create and Modify a Trunk Group List Issue 1 November 1998 Page 143 Create and Modify a Trunk Group List Trunk group lists are useful if you have a large number of trunk groups to manage and you want to streamline the process of setting up a report to be generated. For example, you can specify that the same trunk group list be used for several report definitions.
DEFINITY Performance Management User Guide, Release 2.0, 585-229-808 7 Administer Reports Create and Modify a Trunk Group List 2 Click New List. Result: Displays the Input window.
DEFINITY Performance Management User Guide, Release 2.0, 585-229-808 7 Administer Reports Create and Modify a Trunk Group List Issue 1 November 1998 Page 145 3 Type the name for the new list and click OK. Result: That name appears at the top of the pane in the Trunk Group List field and in the list of available trunk group lists when selecting a trunk group to report on.
DEFINITY Performance Management User Guide, Release 2.0, 585-229-808 7 Administer Reports Create and Modify a Trunk Group List Issue 1 November 1998 Page 146 1 Click DEFINITY Systems > [specific DEFINITY system] > Trunk Groups > Trunk Group Lists. Result: Displays Trunk Group List panel. 2 In the Trunk Group list field, scroll through the list and select the name of the list to be modified. Result: The trunk groups defined for that list displays.
DEFINITY Performance Management User Guide, Release 2.0, 585-229-808 7 Administer Reports Specify Report Interval Issue 1 November 1998 Page 147 Specify Report Interval This procedure describes how to specify the period of time in which to capture data that will be displayed on a Performance report.
DEFINITY Performance Management User Guide, Release 2.0, 585-229-808 7 Administer Reports Specify Report Interval Issue 1 November 1998 Page 148 3 Select one of the following options: • To run a report one time for a specific period of time for a specific date range, click the Fixed button and type the start and end date and time in the respective fields. Type the time in military format.
DEFINITY Performance Management User Guide, Release 2.0, 585-229-808 7 Administer Reports Specify Report Interval Issue 1 November 1998 Page 149 • To run a report periodically, for example, at the end of every week, click the Moving button and type the time span that you want to report on in the time field, or click the arrow button to change the hours.
DEFINITY Performance Management User Guide, Release 2.0, 585-229-808 7 Administer Reports Specify Report Interval Issue 1 November 1998 Page 150 4 If the report does not display on your screen, go to the Send Output tab and make sure Screen is selected. Once you are satisfied with the output, select another output destination on the Send Output tab according to the instructions in "Define Destination of Report Output" on page 163. Reports scheduled to run at a later time cannot be sent to your screen.
DEFINITY Performance Management User Guide, Release 2.0, 585-229-808 7 Administer Reports Schedule a Report Issue 1 November 1998 Page 151 Schedule a Report This procedure describes how to schedule when a report should run at a later time, such as weekly at a specific time. When to Use Use this procedure when you want to schedule a report to run at a later time rather than right now. To run a report immediately, see "Run a Report" on page 167.
DEFINITY Performance Management User Guide, Release 2.0, 585-229-808 7 Administer Reports Schedule a Report 2 Click the Schedule tab. Result: Displays the Schedule tab.
DEFINITY Performance Management User Guide, Release 2.0, 585-229-808 7 Administer Reports Schedule a Report Issue 1 November 1998 Page 153 3 Select one of the following: To run a report... Check this box And type this in the corresponding fields... One time at a specific date and time Run once at The date and hour you want the report to run. Daily Run daily at The hour the report should run. Weekly Run weekly at The day and hour the report should run.
DEFINITY Performance Management User Guide, Release 2.0, 585-229-808 7 Administer Reports Set up Report in Table Format Issue 1 November 1998 Page 154 Set up Report in Table Format This procedure describes how to set up a report in a tabular format. You can specify the sort order of up to three fields on a table in ascending or descending order. Procedure To set up a table in tabular format, do the following: Note: The sort properties defined here stay with the report regardless of its output.
DEFINITY Performance Management User Guide, Release 2.0, 585-229-808 7 Administer Reports Set up Report in Table Format Issue 1 November 1998 Page 155 3 Click table, then the Setup button next to it. Result: Displays the Sort Properties window, where you can define the order of the rows as they appear on the report.
DEFINITY Performance Management User Guide, Release 2.0, 585-229-808 7 Administer Reports Set up Report in Table Format Issue 1 November 1998 Page 156 4 In the three sort fields, select the three fields to sort on, in either ascending or descending order (alphabetical order, from A to Z, or numerical from large to small counts). These are the fields you selected on the Data Fields tab for this report. 5 Click Close.
DEFINITY Performance Management User Guide, Release 2.0, 585-229-808 7 Administer Reports Set up Report in Chart Format Issue 1 November 1998 Page 157 Set up Report in Chart Format This procedure describes how to set up a report to display in a chart format. You can specify the type of chart, its contents, and customize its appearance. Prerequisites The report must already be created in the Performance Management system. See "Create a New Report" on page 124 for creating a report.
DEFINITY Performance Management User Guide, Release 2.0, 585-229-808 7 Administer Reports Set up Report in Chart Format 3 Click chart, then the Setup button next to it. Result: Displays the Chart Properties window.
DEFINITY Performance Management User Guide, Release 2.0, 585-229-808 7 Administer Reports Set up Report in Chart Format Issue 1 November 1998 Page 159 4 In the Chart Type field, select the type of chart: line graph, bar chart, stacked bar chart, or pie chart. 5 Click the Normalize X Axis field to eliminate gaps where no data is available for reporting. For example, if you plot time along the X axis and you collect data only during business hours, there will be gaps on the chart for nights and weekends.
DEFINITY Performance Management User Guide, Release 2.0, 585-229-808 7 Administer Reports Set up Report in Chart Format Issue 1 November 1998 Page 160 6 Optionally, click the Use Aggregator field to select another key field, also called an aggregator field. If you use an aggregator, you can only choose one field for the Y axis. If you do not use an aggregator, you can choose up to 10 Y-axis series as listed in the Y Axis Series field.
DEFINITY Performance Management User Guide, Release 2.0, 585-229-808 7 Administer Reports Set up Report in Chart Format Issue 1 November 1998 Page 161 11 To run the report, see "Run a Report" on page 167.
DEFINITY Performance Management User Guide, Release 2.
DEFINITY Performance Management User Guide, Release 2.0, 585-229-808 7 Administer Reports Define Destination of Report Output Issue 1 November 1998 Page 163 Define Destination of Report Output This procedure describes how to define where the output of a report should go.
DEFINITY Performance Management User Guide, Release 2.0, 585-229-808 7 Administer Reports Define Destination of Report Output Issue 1 November 1998 Page 164 Result: Displays the Send Output tab 3 Do one of the following: • To send the output to the screen, that is, display the report on the screen, click Screen. The report will display on the screen.
DEFINITY Performance Management User Guide, Release 2.0, 585-229-808 7 Administer Reports Define Destination of Report Output Issue 1 November 1998 Page 165 • To send the output to a printer, click Printer. The output will go to a printer. To define print properties, click Setup to display the Print Properties window. Go to the next step. • To send the output to an HTML file, click HTML. The output will go to an HTML file.
DEFINITY Performance Management User Guide, Release 2.0, 585-229-808 7 Administer Reports Define Destination of Report Output Field Description Print Command The print command the system will use to print the report. Page Width The width of the report. The default is 72 characters for portrait mode. Page Height The height of the report. The default is 66 characters for portrait mode. Issue 1 November 1998 Page 166 5 Click Save to save the settings.
DEFINITY Performance Management User Guide, Release 2.0, 585-229-808 7 Administer Reports Run a Report Issue 1 November 1998 Page 167 Run a Report You can set up a report so that it runs automatically as defined in the Schedule tab of the Report Definition pane, or you can run a report manually (on demand) immediately. This procedure describes how to run a report manually. Procedure To run a report, do the following: 1 Click Reports > [report name] > Definition.
DEFINITY Performance Management User Guide, Release 2.0, 585-229-808 7 Administer Reports Run a Report Issue 1 November 1998 Page 168 3 To define the destination of the report, go to "Define Destination of Report Output" on page 163. 4 To define the format of the report, go to "Set up Report in Table Format" on page 154 or "Set up Report in Chart Format" on page 157.
DEFINITY Performance Management User Guide, Release 2.0, 585-229-808 7 Administer Reports Run a Report Issue 1 November 1998 Page 169 5 From any of the tabs on the Report Definition pane, click Run Now. Result: Report will run in the format and to the destination as specified in the preceding steps. If you send the output to a an HTML or ASCII file, a confirmation window appears, specifying the file name and path of the file. The system automatically appends an .htm (for HTML) or .
DEFINITY Performance Management User Guide, Release 2.0, 585-229-808 7 Administer Reports Display Report Output Issue 1 November 1998 Page 170 Display Report Output This procedure describes how to display the output of a previously-run report that is in an HTML or ASCII file format. The system segregates the list of available reports on a daily, run once, weekly, or monthly basis.
DEFINITY Performance Management User Guide, Release 2.0, 585-229-808 7 Administer Reports Display Report Output Issue 1 November 1998 Page 171 2 Click on the tab that matches the schedule of the report you want to see. For example, if you have a report that runs on a monthly basis, then click the Monthly tab. Result: Displays a list of generated reports that match that schedule.
DEFINITY Performance Management User Guide, Release 2.0, 585-229-808 7 Administer Reports Display Report Output Issue 1 November 1998 Page 172 3 To view the report, double click on the desired file name, or single click on the file name and click View. Result: Displays the report. 4 To change any of the report definition parameters, such as the format of the report, go to "Options from a Displayed Report" on page 131.
DEFINITY Performance Management User Guide, Release 2.0, 585-229-808 7 Administer Reports View a Report on a Browser Issue 1 November 1998 Page 173 View a Report on a Browser This procedure describes how to view a Performance Management report in an HTML format on a Web browser. Prerequisites • Make sure you know the World Wide Web location (URL) and the server where the Performance Management files are located. The person that installed Performance Management should know this information.
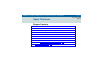
DEFINITY Performance Management User Guide, Release 2.0, 585-229-808 7 Administer Reports View a Report on a Browser Issue 1 November 1998 Page 174 4 Continue to click on the appropriate links until the report you want is listed, as shown in the following sample screen.
DEFINITY Performance Management User Guide, Release 2.0, 585-229-808 7 Administer Reports View a Report on a Browser Issue 1 November 1998 Page 175 5 Click on the file name of the report you want to see. Result: If your browser has the required plug-in, the report displays. If your browser does not have the required plug-in to display the report, go to the next step.
DEFINITY Performance Management User Guide, Release 2.0, 585-229-808 7 Administer Reports View a Report on a Browser Issue 1 November 1998 Page 176 6 If your browser cannot find the plug-in needed for displaying the file, you will be prompted to get the plug in as shown in the following sample screen. Click on the Get the Plug-in button and follow the set up instructions that are provided automatically in order to download and install the plug-in and view the report.
DEFINITY Performance Management User Guide, Release 2.
DEFINITY Performance Management User Guide, Release 2.0, 585-229-808 8 Event Log Introduction Issue 1 November 1998 Page 178 Introduction Purpose of Event Log By using an event log, you can pinpoint any system problems, assess the severity of the problem, and view the history to the problems. At that point you can close out the event causing the problem, or you can investigate and take care of the problem using the information provided by the event log.
DEFINITY Performance Management User Guide, Release 2.
Issue 1 November 1998 Page 180 DEFINITY Performance Management User Guide, Release 2.0, 585-229-808 8 Event Log Using the Event Log Using the Event Log Description The event log displays all of the events for the either all managed nodes, or events specific to selected parts of a managed node. An event is an occurrence or condition that the system detects and is recorded in the event log.
DEFINITY Performance Management User Guide, Release 2.0, 585-229-808 8 Event Log Using the Event Log To view this event log... From the left pane, click... Issue 1 November 1998 Page 181 The system displays...
DEFINITY Performance Management User Guide, Release 2.0, 585-229-808 8 Event Log Using the Event Log Event Log description Issue 1 November 1998 Page 182 The fields in the event log are described as follows. Newest active events are displayed at the top, followed by resolved events, with newest resolved events listed first.
DEFINITY Performance Management User Guide, Release 2.0, 585-229-808 8 Event Log Using the Event Log Issue 1 November 1998 Page 183 Event Column Description First column Icons representing one of five alert levels. The levels, in order of increasing severity, are: Warning, Minor, Major, and Critical. The highest active alert icon will be displayed the left pane for each alertable node. An event generates an alert when it does not have an end time.
DEFINITY Performance Management User Guide, Release 2.0, 585-229-808 8 Event Log Using the Event Log Issue 1 November 1998 Page 184 Event Column Description End The time when either the system or a user ends the event. The time is in the local time zone where the Performance Management system is located. Node The network component that caused the event to be logged, such as Data Collection. Resource The monitored resource at the node that caused the event to be logged.
DEFINITY Performance Management User Guide, Release 2.0, 585-229-808 8 Event Log Resolve an Event Issue 1 November 1998 Page 185 Resolve an Event Introduction Active events normally end automatically by the system when new data is obtained about the situation that caused the event to be logged in the event log. For example, a report event ends when an attempt is made to generate the report again. If the report fails again, a new event is recorded in the event log.
DEFINITY Performance Management User Guide, Release 2.
DEFINITY Performance Management User Guide, Release 2.0, 585-229-808 9 Set Alerting Parameters Introduction Issue 1 November 1998 Page 187 Introduction Alerts are visual reminders of any problems in the DEFINITY system. Alerting is also used by the NMS to identify problems associated with a specific managed node. You can define what events trigger alerts and at what level of severity. You can then tell at a glance by looking in the left pane of Performance Management where the problems are.
DEFINITY Performance Management User Guide, Release 2.0, 585-229-808 9 Set Alerting Parameters About Alert Levels Issue 1 November 1998 Page 188 About Alert Levels When setting alerting parameters as described in this chapter, you need to specify the level of severity attached to each condition that causes an alert to occur. The level of security is a visual cue to remind you of the severity of the problem associated with a specific managed node.
DEFINITY Performance Management User Guide, Release 2.0, 585-229-808 9 Set Alerting Parameters About Alert Levels Escalation of Alert Most severe alert escalated to DEFINITY Systems node Issue 1 November 1998 Page 189 The highest alert icon will display for each node of that managed node. For example, in the following example, the highest level alert icon, a major alert icon, appears not only next to the event log for that managed node, but also next to the managed node.
DEFINITY Performance Management User Guide, Release 2.0, 585-229-808 9 Set Alerting Parameters Set Global Alerting Parameters Issue 1 November 1998 Page 190 Set Global Alerting Parameters This procedure describes how to set alerting parameters for the Performance Management system.
DEFINITY Performance Management User Guide, Release 2.0, 585-229-808 9 Set Alerting Parameters Set Global Alerting Parameters Issue 1 November 1998 Page 191 2 In the Maximum days to maintain event history field, enter the number of days you want to retain event data in the database log. At midnight of each day, old records are purged if their start time is older than the maximum allowed days.
DEFINITY Performance Management User Guide, Release 2.0, 585-229-808 9 Set Alerting Parameters Set Global Alerting Parameters Issue 1 November 1998 Page 192 3 In the Data Collection box, do you want the system to record data collection failures in the event log? • If yes, put a check mark in the box next to the Log Event on failure field. Set the alert level for the event by clicking on the arrow in the Alert level pull-down list and selecting one of the options. • If no, leave the box unchecked.
DEFINITY Performance Management User Guide, Release 2.0, 585-229-808 9 Set Alerting Parameters Set Global Alerting Parameters Issue 1 November 1998 Page 193 • If no, leave the box unchecked. The system will not record any call processing occupancy exceptions in the event log. The G3r occupancy threshold field reflects the maximum percent of CPU occupancy being used by the call processing software for DEFINITY G3r switches before an event is generated.
DEFINITY Performance Management User Guide, Release 2.0, 585-229-808 9 Set Alerting Parameters Set Global Alerting Parameters Issue 1 November 1998 Page 194 The Erlang C model assumes that there is an infinite queue for calls trying to access the trunk group to wait in until resources are available. This means that all calls are eventually served. The Retrial model assumes that some calls are blocked but will retry.
DEFINITY Performance Management User Guide, Release 2.0, 585-229-808 9 Set Alerting Parameters Set Processor Occupancy Alerting Parameters Issue 1 November 1998 Page 195 Set Processor Occupancy Alerting Parameters Introduction This procedure describes how to override the default processor occupancy alerting parameters for a specific managed node.
DEFINITY Performance Management User Guide, Release 2.0, 585-229-808 9 Set Alerting Parameters Set Processor Occupancy Alerting Parameters Issue 1 November 1998 Page 196 2 Do one of the following: • To use the global default processing occupancy parameters, click the Use default values button. • To customize the parameters for this managed node, click the Use custom values button.
DEFINITY Performance Management User Guide, Release 2.0, 585-229-808 9 Set Alerting Parameters Set Processor Occupancy Alerting Parameters Issue 1 November 1998 Page 197 3 Do you want the system to record call processing occupancy exceptions in the event log? • If yes, put a check mark in the box next to “Log event when exception occurs”. • If no, leave the box unchecked. The system will not record any call processing occupancy exceptions in the event log.
DEFINITY Performance Management User Guide, Release 2.0, 585-229-808 9 Set Alerting Parameters Set Trunk Group Alerting Parameters Issue 1 November 1998 Page 198 Set Trunk Group Alerting Parameters Introduction This procedure describes how to override the default trunk group alerting parameters for a specific managed node. Procedure To set the trunk group alerting parameters, do the following: 1 From the left window pane, click DEFINITY Systems > [managed node] > Trunk Groups > Alerting Parameters.
DEFINITY Performance Management User Guide, Release 2.0, 585-229-808 9 Set Alerting Parameters Set Trunk Group Alerting Parameters Issue 1 November 1998 Page 199 2 Click in the Default column for the trunk group you want to change so that the Default? box is unchecked. Result: You can now change the parameters in the remaining columns. Note: If the Default box is checked, the system will use the global default values to determine when to record alerts.
DEFINITY Performance Management User Guide, Release 2.0, 585-229-808 9 Set Alerting Parameters Set Trunk Group Alerting Parameters Issue 1 November 1998 Page 200 3 In the Log column, put a checkmark in the box if you want the system to record trunk group grade of service exceptions. If you do not want to record exceptions, leave the box unchecked. 4 In the Level column, set the alert level for the event by clicking on the arrow in the Alert level pull-down list and selecting one of the options.
DEFINITY Performance Management User Guide, Release 2.
DEFINITY Performance Management User Guide, Release 2.0, 585-229-808 10 Maintenance and Error Recovery Introduction Issue 1 November 1998 Page 202 Introduction This chapter describes various aspects of maintaining Performance Management. It also describes how the system recovers from various errors.
DEFINITY Performance Management User Guide, Release 2.0, 585-229-808 10 Maintenance and Error Recovery Error Recovery Issue 1 November 1998 Page 203 Error Recovery Performance Management handles errors in the following manner: Type of Error Description How System Handles SNMP errors Errors returned to the application software from the lowest SNMP software. Usually result in data collection failure. • Informs user of error by alert in Data Collection node in left pane.
DEFINITY Performance Management User Guide, Release 2.0, 585-229-808 10 Maintenance and Error Recovery Error Recovery Type of Error Description SNMP No Response Problem with the network or Proxy Agent. Issue 1 November 1998 Page 204 How System Handles • Retries the request. If retries fail, displays an alert in the Data Collection node. • Logs the error in the event log. • Posts an alert in the Data Collection node.
DEFINITY Performance Management User Guide, Release 2.0, 585-229-808 10 Maintenance and Error Recovery System Notification of Errors Issue 1 November 1998 Page 205 System Notification of Errors Performance Management provides information for errors that can prevent the system from performing its task.
DEFINITY Performance Management User Guide, Release 2.0, 585-229-808 10 Maintenance and Error Recovery Process Trace Issue 1 November 1998 Page 206 Process Trace Description Each pprocess writes a message to a common trace file. The message has: • Time stamp • Process name • User name • Managed node name (or “DPM” if message is not related to a managed node) • Text description that varies with the message type About LOG and TRACE Message types LOG and TRACE are normal application progress messages.
DEFINITY Performance Management User Guide, Release 2.0, 585-229-808 10 Maintenance and Error Recovery Event Types Exception and Error Issue 1 November 1998 Page 207 Event Types Exception and Error The start and end of an exception or error alert is logged in the trace file.
DEFINITY Performance Management User Guide, Release 2.0, 585-229-808 10 Maintenance and Error Recovery Message Type SWERR Issue 1 November 1998 Page 208 Message Type SWERR These are internal software errors that do not cause an alert, though they may cause other failures that will cause alerts.
DEFINITY Performance Management User Guide, Release 2.0, 585-229-808 10 Maintenance and Error Recovery Delete Managed Node from Database Issue 1 November 1998 Page 209 Delete Managed Node from Database When a managed node is permanently removed from the Proxy Agent, its data remains in the database. Since the data for the managed node is not necessary, you can delete the data from the database by following this procedure.
DEFINITY Performance Management User Guide, Release 2.
DEFINITY Performance Management User Guide, Release 2.
DEFINITY Performance Management User Guide, Release 2.
DEFINITY Performance Management User Guide, Release 2.
DEFINITY Performance Management User Guide, Release 2.
DEFINITY Performance Management User Guide, Release 2.
DEFINITY Performance Management User Guide, Release 2.
DEFINITY Performance Management User Guide, Release 2.0, Index 585-229-808 Issue 1 November 1998 Page 217 N NetCare® Network Consulting Group, to get help from 19 network management products, supported by Performance Management 2.0 25 Network Management System, see NMS 26 NMS capabilities for DEFINITY 26 platforms supported by Performance Management 2.
DEFINITY Performance Management User Guide, Release 2.
DEFINITY Performance Management User Guide, Release 2.
DEFINITY Performance Management User Guide, Release 2.
DEFINITY Performance Management User Guide, Release 2.
DEFINITY Performance Management User Guide, Release 2.0, Index static connection, explanation of 49 status bar 87, 98 storage duration to specify default 112 to specify for managed node 115 submap custom 40, 45 DEFINITY icons for 45 generic 40 –42 USA 40, 43 –44 submap icons, examples of 41 supported systems by Fault Management 2.0 78 NMS products 78 supported systems, by Performance Management 2.
DEFINITY Performance Management User Guide, Release 2.