
Specifications

6
RANAdvisor TrueSite
www.jdsu.com/nse
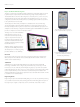
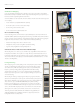
Customizable for the Needs of Each Engineer
Displaying hundreds of parameters helps engineers see everything they want; however,
in many cases, they are only interested in specic parameters for each technology. The
customizable GUI lets each engineer congure their device to display only the parameters
they need to perform their work. For engineers who share devices, each engineer can save
their customized view to a prole on the device that they can load when they use the device.
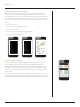
Users can:
• Customize screen views
• Choose the number of parameters needed
• Save multiple screen layouts
• Recall saved screen layouts during recording or playback
• Share screen layouts with other users
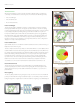
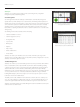
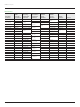
User-Defined Interactive Charting
Create your own specic line charts with just the measurements that you need to view.
Up to four dierent charts can be dened to appear in the RF Measurement screen to
enable real-time analysis over the time of selected measurements such as RSRP. Up to four
measurements can be dened per chart. Thirteen charts are delivered with the software,
however, users can create and save their own charts for future use. An example LTE chart is
shown opposite.
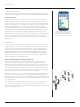
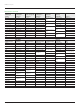
Interactive charting allows any measurement displayed on the RF measurement screen to be
charted during testing by tapping the required measurement. Multiple measurements can
be charted as shown opposite. When nished, tapping the measurement will remove the chart.