
Troubleshooting guide


February 2006 185
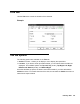
Selecting a chart type
To select a chart type:
1. Based on whether you want the report to display two-dimensionally or
three-dimensionally, select 2D or 3D.
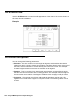
2. Select the Chart Type.
● The available types for two-dimensional charts are Bar, Line, Area, Step,
Horizontal Bar, and Pie.
● The available types for three-dimensional charts are Bar, Line, Area, Step,
Clustered Bar, Horizontal Bar, and Pie.
3. For any type of report other than Pie, you can select the Stacked check box to display
all series together rather than separately.
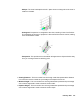
If you select the Stacked check box, you can also select the % Axis check box, which
causes the y-axis to be displayed as percentages rather than as data values.
4. Do one of the following tasks:
● Select Apply to make the changes and to keep the Chart Format Options window
open.
● Select OK to make the changes and to close the Chart Format Options window.