
Troubleshooting guide


February 2006 169
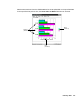
Changing axis titles
To change the title that will display on each axis of the chart report:
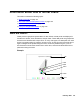
1. Depending on the type of chart you are formatting, select the appropriate Axis check
box.
The following are examples of chart types: bar, line, area, step, clustered bar,
horizontal bar, or pie as selected on the Type tab.
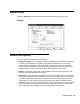
2. In the appropriate text box, enter the title you want assigned to the axis.
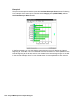
3. In the Category for X-Axis box, which is the same as the Available Items box in the
Insert Query Chart Assistant, select the database item that you want to use as the
category for the chart. The Category is usually none for real-time charts, or a time
database item for historical charts.
4. Select the Show Value as Name check box if you want to show the selected category
as a Dictionary name. This check box is available only when the selected category is
an item that can be defined in the Dictionary.
5. Select the Format in which the category will be displayed.
Use the drop-down list to select from the applicable formats for the selected category.
If you want to view all of the available formats for all types of data, select the Show All
Formats check box.
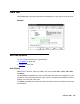
6. Select the One Data Value per Row check box to show one line of data when multiple
rows of data are retrieved in the query.
When One Data Value per Row is selected, the first item listed in the Category for
X-Axis drop-down list is the item that is used for the chart category.
7. Do one of the following actions:
● Select Apply to make the changes and to keep the Chart Format Options window
open.
● Select OK to make the changes and to close the Chart Format Options window.