
Troubleshooting guide


164 Avaya CMS Supervisor Report Designer
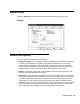
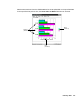
Changing general chart parameters
To change general chart parameters:
1. In the Background Color box, select Report Background, Solid, or Gradient.
2. In the Options box, select the check boxes, as appropriate.
● Select Grid Lines On to include the lines between rows and columns on any grid
that displays on the chart.
● Select Chart Border On to include a border around the chart.
● Select Legend Border On to include a border around the chart legend.
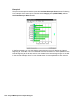
3. If the report you want to design is a real-time report, or if it is a real-time component of
an integrated report, you can make the chart a rolling chart. To do this, select the
Rolling Chart check box and then define the Number of Data Points that you want
displayed on the chart.
Permitted values for the number of data points are 2 through 100.
4. Select Apply to make the changes and to keep the Chart Format Options window
open.
5. Select OK to make the changes and to close the Chart Format Options window.
If you select … Then …
Report
Background
The background of the report will default to the color
you set on the Options Report Colors tab which is
accessed from the Controller Tools menu.
Solid Select the square next to the Background Color
option to set the color of the report background.
Gradient The report background will combine the two colors you
select in the squares to the right of the Gradient
Colors option.
You can select the type of gradient that will be used
from the drop-down list below the Gradient option.
The available types are horizontal, vertical, rectangle,
and oval.