
Troubleshooting guide


February 2006 163
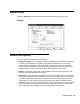
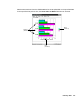
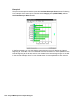
General tab
Select the General tab to specify several general options that apply to the chart.
Example
General tab options
You can change the following chart parameters:
● Background Color - You can specify whether the backdrop of the chart is a solid color
or whether it is displayed as a gradient. The gradient transition can be one of the
following options: horizontal, vertical, rectangle, or oval. The quality of the gradient
effect will vary depending on what video card is installed in the PC. The quality of the
gradient effect for printed reports depends on the capabilities of the printer.
● Options - Select the check boxes, as appropriate, to include or omit grid lines, chart
borders, and legend borders on the report.
● Real-Time - If the chart is part of a real-time report and is a rolling chart, you can specify
the number of data points to be displayed in the chart. Permitted values are 2 through
100, with 10 the default. A rolling chart is a line chart that is initially displayed with no
data points. For each refresh of the report, a data point is added. As data points are
added, the chart “rolls” from left to right. When enough refreshes have occurred that the
chart displays the number of specified data point, at the next refresh, the oldest data
point is dropped from the display and the newest data point is displayed.