
Troubleshooting guide


136 Avaya CMS Supervisor Report Designer
About the Chart Assistant window
Use this window to define how the data will be displayed on the axis of the chart.
Column descriptions
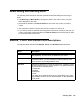
There are three columns used to define the category and series for the chart. The
information gathered by each column is as follows:
● Column 1 - Category (can be none)
● Column 2 - Series (usually Split)
● Column 3 - Data
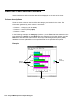
In the following example, the Category (Column 1) is the Time that was selected on the
input window, the Series are the Splits that were selected on the input window, and the
Data is the data that was retrieved from the Avaya Call Management System (CMS)
database for those splits/skills on the specified date for the specified time period.
Example
Category
Series
Data
(Column 1)
(Column 2)
(Column 3)