
Troubleshooting guide


February 2006 135
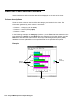
About adding and removing items
The following items should be read and understood about the adding and removing of
items:
● Use Move Up and Move Down to arrange the items in the order in which you want
them displayed on the chart.
● Items that are added to the Data on Chart box are shown in the chart you want to
create.
● The maximum number of columns that can be included on a chart is 16.
● If you want to create a chart that uses categories and series as controls on the axis, you
need to verify that the first item listed on the Data on Chart box is the item that you want
to use as the series for the chart.
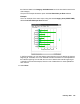
Stacked, % Axis, and Gradiant field descriptions
The following table describes the Stacked, % Axis, and Gradiant field descriptions.
Field Description
Stacked Displays the data for all series as stacked rather than displaying the
data separately. This check box is disabled for pie charts.
% Axis Displays the value axis (y-axis) as percentages rather than as
actual data values. You can combine this with the stacked check
box to produce a percentage-stacked chart.
Gradient Specifies the backdrop of a chart as a solid color, a gradient, or as a
smooth transition from one color to another. The gradient transition
can be one of the following items:
● Horizontal
● Vertical
● Rectangle
● Oval
The quality of the gradient effect will vary, depending on the video
card installed in the PC, and for printed reports, on the capabilities
of the printer.