
Troubleshooting guide


134 Avaya CMS Supervisor Report Designer
Information about how to insert charts
This section includes the following topics:
● About inserting charts on page 134
● About charts and tables on page 134
● About fields and text on page 134
● About adding and removing items on page 135
● Stacked, % Axis, and Gradiant field descriptions on page 135
● About the Chart Assistant window on page 136
About inserting charts
There are two things to keep in mind when inserting charts onto a report:
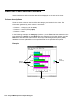
● When you insert a chart on a report, the chart is shown with sample data. This helps you
visualize how the chart will display when you run the report.
● Each item is initially inserted in the upper-left corner of the report. You need to
drag-and-drop the chart to the location where you want it to be displayed on the report.
About charts and tables
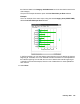
If the report includes both a chart and a table, you need to place the chart above the table
on the report. The reason for this is that if the table spans multiple pages when printed and
if the chart is below the table, the table will print above the chart.
About fields and text
Do not position any fields or text over the chart because the chart will be displayed over the
field or text, so that the field or text are not visible.