
Owners manual


61 | Instant User Interface Aruba Instant 6.4.0.2-4.1 | User Guide
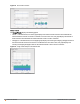
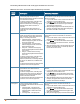
Figure 18 RF Trends for Clients
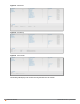
Usage Trends
The Usage Trends displays the following graphs:
l Clients — In the default view, the Clients graph displays the number of clients that were associated with the
Virtual Controller in the last 15 minutes. In Network or Access Points view, this graph displays the number of
clients that were associated with the selected network or IAP in the last 15 minutes.
l Throughput— In the default view, the Throughput graph displays the incoming and outgoing throughput traffic for
the Virtual Controller in the last 15 minutes. In the Network or Access Points view, this graph displays the
incoming and outgoing throughput traffic for the selected network or IAP in the last 15 minutes.
Figure 19 Usage Trends Graphs in the Default View