
Owners manual
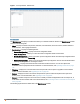
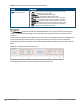

Icon Name Description
1 Signal
Icon
Displays the signal strength of the client. Depending on the signal strength of the client, the color
of the lines on the Signal bar changes from Green > Orange > Red.
l Green— Signal strength is more than 20 decibels.
l Orange— Signal strength is between 15-20 decibels.
l Red— Signal strength is less than 15 decibels.
To view the signal graph for a client, click on the signal icon next to the client in the Signal
column.
2 Speed
icon
Displays the data transfer speed of the client. Depending on the data transfer speed of the client,
the color of the Signal bar changes from Green > Orange > Red.
l Green— Data transfer speed is more than 50 percent of the maximum speed supported by
the client.
l Orange— Data transfer speed is between 25-50 percent of the maximum speed supported by
the client.
l Red— Data transfer speed is less than 25 percent of the maximum speed supported by the
client.
To view the data transfer speed graph of a client, click on the speed icon against the client in the
Speed column.
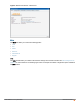
3 Utilization
icon
Displays the radio utilization rate of the IAPs. Depending on the percentage of utilization, the
color of the lines on the Utilization icon changes from Green > Orange > Red.
l Green— Utilization is less than 50 percent.
l Orange— Utilization is between 50-75 percent.
l Red— Utilization is more than 75 percent.
To view the utilization graph of an IAP, click the Utilization icon next to the IAP in the Utilization
column.
4 Noise icon Displays the noise floor details for the IAPs. Noise is measured in decibels/meter. Depending on
the noise floor, the color of the lines on the Noise icon changes from Green > Orange > Red.
l Green— Noise floor is more than 87 dBm.
l Orange— Noise floor is between 80 dBm-87 dBm.
l Red— Noise floor is less than 80 dBm.
To view the noise floor graph of an IAP, click the noise icon next to the IAP in the Noise column.
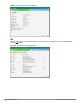
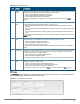
5 Errors
icon
Displays the errors for the IAPs. Depending on the errors, color of the lines on the Errors icon
changes from Green > Yellow > Red.
l Green— Errors are less than 5000 frames per second.
l Orange— Errors are between 5000-10000 frames per second.
l Red— Errors are more than 10000 frames per second.
To view the errors graph of an IAP, click the Errors icon next to the IAP in the Errors column.
Table 10:
RF Dashboard Icons
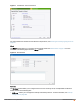
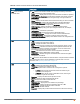
RF Trends
The RF Trends section displays the following graphs for the selected AP and the client. To view the details on the
graphs, click the graphs and hover the mouse on a data point:
Figure 17 RF Trends for Access Point
Aruba Instant 6.4.0.2-4.1 | User Guide Instant User Interface | 60