RealView Debugger ™ Version 1.6 Essentials Guide Copyright © 2002 ARM Limited. All rights reserved.
RealView Debugger Essentials Guide Copyright © 2002 ARM Limited. All rights reserved. Release Information The following changes have been made to this document. Change History Date Issue Change April 2002 A RealView Debugger 1.5 release. September 2002 B RealView Debugger v1.6 release. Proprietary Notice Words and logos marked with ® or ™ are registered trademarks or trademarks owned by ARM Limited. Other brands and names mentioned herein may be the trademarks of their respective owners.
Contents RealView Debugger Essentials Guide Preface About this book .............................................................................................. vi Feedback ....................................................................................................... xi Chapter 1 About RealView Debugger 1.1 1.2 1.3 1.4 Chapter 2 RealView Debugger v1.6 ............................................................................ 2-2 Getting more information online .............................
Contents Chapter 4 Quick-start Tutorial 4.1 4.2 4.3 4.4 4.5 4.6 Chapter 5 Ending your RealView Debugger Session 5.1 5.2 5.3 Chapter 6 Saving the session ..................................................................................... 5-2 Disconnecting from a target ........................................................................ 5-5 Exiting RealView Debugger ........................................................................ 5-7 RealView Debugger Desktop 6.1 6.2 6.3 6.4 6.5 6.6 6.
Preface This preface introduces the RealView Debugger Essentials Guide. This guide shows you how to start using RealView Debugger to manage software projects and to debug your application programs. It contains the following sections: • About this book on page vi • Feedback on page xi. ARM DUI 0181B Copyright © 2002 ARM Limited. All rights reserved.
Preface About this book RealView Debugger provides a powerful tool for debugging and managing software projects.
Preface Chapter 4 Quick-start Tutorial Read this chapter when you have access to a workstation. Follow the step-by-step instructions to gain some experience of using RealView Debugger to manage a project and to debug software. Chapter 5 Ending your RealView Debugger Session This chapter describes how to end your RealView Debugger session and exit the debugger. Chapter 6 RealView Debugger Desktop Read this chapter for a detailed description of the contents of the RealView Debugger desktop.
Preface ARM publications This book is part of the RealView Debugger documentation suite. Other books in this suite include: • RealView Debugger v1.6 User Guide (ARM DUI 0153) • RealView Debugger v1.6 Target Configuration Guide (ARM DUI 0182) • RealView Debugger v1.6 Command Line Reference Guide (ARM DUI 0175) • RealView Debugger v1.6 Extensions User Guide (ARM DUI 0174). If you are using RealView Debugger with the ARM Developer Suite (ADS) v1.
Preface • ARM-Thumb® Procedure Call Standard (ATPCS) Specification (SWS ESPC 0002). Refer to the following documentation for information relating to the ARM debug interfaces suitable for use with RealView Debugger: • ARM Agilent Debug Interface v1.0 User Guide (ARM DUI 0158) • Multi-ICE version 2.2.2 User Guide (ARM DUI 0048).
Preface Contact information for MaxCore from AXYS is available at: http://www.axysdesign.com. x Copyright © 2002 ARM Limited. All rights reserved.
Preface Feedback ARM Limited welcomes feedback on both RealView Debugger and its documentation. Feedback on RealView Debugger If you have any problems with RealView Debugger, please submit a Software Problem Report: 1. Select Help → Send a Problem Report... from the RealView Debugger main menu. 2. Complete all sections of the Software Problem Report. 3. To get a rapid and useful response, please give: 4.
Preface xii Copyright © 2002 ARM Limited. All rights reserved.
Chapter 1 About RealView Debugger This chapter introduces RealView Debugger. It explains how the debugger provides a development environment for embedded systems applications using the ARM family of processors. This chapter contains the following sections: • RealView Debugger on page 1-2 • About the debugging environment on page 1-4 • Debugging mode on page 1-6 • Using the documentation suite on page 1-7. ARM DUI 0181B Copyright © 2002 ARM Limited. All rights reserved.
About RealView Debugger 1.1 RealView Debugger RealView Debugger enables you to debug your embedded application programs and have complete control over the flow of the program execution so that you can quickly isolate and correct errors. 1.1.1 RealView Debugger concepts and terminology The following terminology is used throughout the RealView Debugger documentation suite to describe debugging concepts: Debug target A piece of hardware or simulator that runs your application program.
About RealView Debugger Multithreaded operation RTOS processes can share the memory of the processor so that each can share all the data and code of the others. These are called threads. RealView Debugger enables you to: ARM DUI 0181B • attach Code windows to threads to monitor one or more threads • select individual threads to display the registers, variables, and code related to that thread • change the register and variable values for individual threads. Copyright © 2002 ARM Limited.
About RealView Debugger 1.2 About the debugging environment RealView Debugger uses a three-tier environment to debug application programs: • the debugger software • the debug interface layer, incorporating the execution vehicles • the debug target. RealView Debugger uses connection information to describe: • how the debugger connects to the debug target • information required to use that connection • what kind of processor the target is using.
About RealView Debugger RealView Connection Broker RealView Connection Broker operates in two modes: Local Operating as RealView Connection Broker, this runs on your local workstation and enables you to access local targets. Remote Operating as RealView Network Broker, this runs on a remote workstation and makes specified targets on that workstation available to other workstations connected to the same network. 1.2.
About RealView Debugger 1.3 Debugging mode The base installation of RealView Debugger enables you to debug your images in single connection mode, that is, where there is only one connection. If you have the appropriate license, you can also debug multiprocessor applications. RealView Debugger supports such multiprocessor debugging by maintaining connections to multiple debug targets through one or more Code windows.
About RealView Debugger 1.4 Using the documentation suite The RealView Debugger documentation suite consists of five books: • RealView Debugger v1.6 Essentials Guide • RealView Debugger v1.6 User Guide • RealView Debugger v1.6 Target Configuration Guide • RealView Debugger v1.6 Command Line Reference Guide • RealView Debugger v1.6 Extensions User Guide. At the front of each book is a Preface describing how the contents are organized and how information is presented in the chapters.
About RealView Debugger 1-8 Copyright © 2002 ARM Limited. All rights reserved.
Chapter 2 Features of RealView Debugger This chapter describes the features of RealView Debugger and highlights new functionality in RealView Debugger v1.6. It contains the following sections: • RealView Debugger v1.6 on page 2-2 • Getting more information online on page 2-5. ARM DUI 0181B Copyright © 2002 ARM Limited. All rights reserved.
Features of RealView Debugger 2.1 RealView Debugger v1.6 RealView Debugger v1.6 provides a range of features for the developer: • Multi-core debugging • OS awareness • Extended Target Visibility (ETV) • Advanced debugging facilities • Trace, Analysis, and Profiling on page 2-3 • Project manager on page 2-4 • RealView Debugger downloads on page 2-4. 2.1.1 Multi-core debugging RealView Debugger v1.6 provides a single debug kernel for mixed ARM and DSP debugging.
Features of RealView Debugger 2.1.5 • There is now support for module statics, that is static variables of non-local scope, in the Call Stack pane (new in v1.6). • RealView Debugger offers a powerful command-line interface and scripting capability that includes macros support, conversion from ARM AXD and armsd, and history lists to record previous actions. • Users can access a console (headless debugger) driven from the command line or from scripts (new in v1.6).
Features of RealView Debugger • • • • • viewing disassembly trace tracing of function calls the profiling of time spent in each function the ability to filter captured trace data by field the ability to sort captured trace data by field. You can set tracepoints directly in the source-level view and/or the disassembly-level view. The same functionality is available in the Memory pane so that you can select regions in memory to trace, or trace a specific memory value when it changes. 2.1.
Features of RealView Debugger 2.2 Getting more information online The full documentation suite is available online as DynaText, XML, and PDF files. Select Start → Programs → RealView Debugger v1.6 from the Windows Start menu. From here: • select Online Books to view the DynaText files • select XML Documentation to see the XML version. You can also access the DynaText files from the Help menu when RealView Debugger is running.
Features of RealView Debugger 2-6 Copyright © 2002 ARM Limited. All rights reserved.
Chapter 3 Getting Started with RealView Debugger This chapter gives step-by-step instructions to get started with RealView Debugger, including making a connection and loading an image for debugging. It also covers the main tasks that you might carry out in a debugging session. It contains the following sections: • Starting RealView Debugger on page 3-2 • Connecting to a target on page 3-4 • Working with memory on page 3-7 • Loading an image on page 3-10 • Debugging an image on page 3-14.
Getting Started with RealView Debugger 3.1 Starting RealView Debugger To start your debugging session, you must complete the following steps: 1. Start RealView Debugger. 2. Connect to your chosen debug target. 3. Load an image for debugging. This section describes how to start RealView Debugger and display the default Code window. It contains the following sections: • Starting RealView Debugger • The Code window. 3.1.1 Starting RealView Debugger To start RealView Debugger: 1.
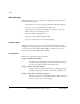
Getting Started with RealView Debugger Color Box Title bar Toolbars Pane Management controls Build controls Processor State Side pane File Editor pane Output pane Pane title bar Command line Status line Cursor location field Keyboard status Figure 3-1 Code window The appearance of the Code window depends on your licenses. For example, the base installation enables you to debug your images in single connection mode, that is where there is only one connection.
Getting Started with RealView Debugger 3.2 Connecting to a target The next stage in your debugging session is to connect to your debug target. The base installation of RealView Debugger includes built-in configuration files to enable you to make a connection without having to modify any configuration details. This section introduces target configuration and how to make a connection: • Target configuration • Working with connections • Making a connection on page 3-5 • Setting connect mode on page 3-6. 3.
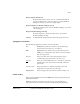
Getting Started with RealView Debugger Check box to make a connection RDI execution vehicle Connections available for this vehicle Execution vehicles Figure 3-2 Connection Control window This window dynamically details all your connections during a debugging session. Note If you are licensed to use RealView Debugger extensions, the Connection Control window includes tabs, not shown here. For example, in multiprocessor debugging mode, the window includes a Connect tab and a Synch tab. 3.2.
Getting Started with RealView Debugger • panes are updated with debug information, for example the Register pane shows the core registers for the connected target. Where you are always debugging code on the same target you can configure RealView Debugger to make the same connection automatically each time it starts. See the chapter describing connecting to targets in RealView Debugger v1.6 Target Configuration Guide for details of how to set this option.
Getting Started with RealView Debugger 3.3 Working with memory Before you load an image, you might have to define memory settings. This depends on the debug target you are using to run your image. For example, if you are using the default ARMulator to simulate an ARM processor, setting the value of top of memory is not appropriate. Where appropriate, defining memory gives you full access to all the memory on your debug target.
Getting Started with RealView Debugger 3.3.2 Setting top of memory for a session If you are working with an appropriate debug target, you can set the value of top of memory on a temporary basis, that is for the current session, using the @top_of_memory register.
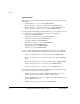
Getting Started with RealView Debugger Figure 3-4 Changed settings in the Register pane The value of top of memory might be displayed in dark blue to show that it has changed since the last update. If you set this value too low, loading an image to your target might generate a warning message in the Cmd tab: Warning: No room for heap - could cause unpredictable behavior. For full details on setting top of memory for an ARM-based target, see the chapter describing memory mapping in RealView Debugger v1.
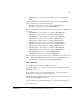
Getting Started with RealView Debugger 3.4 Loading an image When you have connected to a suitably configured debug target you are ready to load your image for debugging: • Loading an image • What is shown in the title bar? on page 3-12 • Reloading an image on page 3-12 • Unloading an image on page 3-13. 3.4.1 Loading an image In this example, you load the image dhrystone.axf installed as part of the base installation.
Getting Started with RealView Debugger Figure 3-5 Code window with an image loaded In this Code window Text Coloring is enabled by default and line numbering is turned on by selecting Edit → Editing Controls → Show Line Numbers.
Getting Started with RealView Debugger 3.4.2 What is shown in the title bar? The Code window title bar gives details of the connection and any processes running on your debug target. If you connect to a target and load an image, your title bar looks like the one shown in Figure 3-6. Figure 3-6 Code window title bar In addition to the application icon, you can see (from left to right): RVDEBUG Identifies the Code window.
Getting Started with RealView Debugger 3.4.4 Unloading an image You do not have to unload an image from a debug target before loading a new image for execution. Display the Load File to Target dialog box and ensure that the Replace Existing File(s) check box is selected ready to load the next image. However, you might want to unload an image explicitly as part of your debugging session, for example if you correct coding errors and then rebuild outside RealView Debugger.
Getting Started with RealView Debugger 3.5 Debugging an image Chapter 4 Quick-start Tutorial provides details on using the features of RealView Debugger with your images. This section summarizes how to start debugging with RealView Debugger: • Getting started • Code views on page 3-15 • Viewing target status on page 3-15. 3.5.1 Getting started You can start debugging your image when you have completed the following steps: 1. Start RealView Debugger, see Starting RealView Debugger on page 3-2. 2.
Getting Started with RealView Debugger 8. 3.5.2 To start execution either: • Select Debug → Execution Control → Go (Start Execution) from the main menu. • Click the Go button on the Actions toolbar. 9. Enter the required number of runs, for example 50000. 10. Monitor execution until the breakpoint is reached. 11. Click Go again and monitor the programas execution continues. Code views Use the File Editor pane to view source code during your debugging session.
Getting Started with RealView Debugger 3-16 Copyright © 2002 ARM Limited. All rights reserved.
Chapter 4 Quick-start Tutorial This chapter provides a step-by-step tutorial using RealView Debugger to debug your images. All the tasks introduced in this chapter, and the RealView Debugger options used, are described in full in RealView Debugger v1.6 User Guide.
Quick-start Tutorial 4.1 How to use the tutorial The tutorial starts by setting up a user-defined project to build an image for debugging. A user-defined project in RealView Debugger is not required for debugging, but it can provide a powerful aid to development. A project enables RealView Debugger to save your list of files, understand your build model, and maintain a record of your project-level preferences.
Quick-start Tutorial 4.2 Setting up your first project RealView Debugger enables you to set up different types of user-defined projects: • Standard project, including Compile/Assemble/Link • Library project, including Compile/Assemble/Add to library • Custom project, using your makefile or defining a no-build project to hold only image and properties • Container project, composed of existing projects • Copy, created by copying existing projects.
Quick-start Tutorial 4.2.1 Defining your build tools RealView Debugger provides support for multiple toolchains. The debugger can locate your build tools automatically based on your environment variables or Registry entries. You can use the default build tools in every project you create or to build source files outside a project. However, you can override these settings for specific projects if required. To see the default toolchain: 1. Select Project → Build-Tool Properties...
Quick-start Tutorial Note For details on how to change your build tools see Changing build tools on page 4-29. 4.2.2 Creating a new project To set up the new project: 1. Select Project → New Project... from the default Code window main menu. This displays the Create New Project dialog box. The Project Base field might be prefilled with your RealView Debugger installation directory name as defined by your environment variable. You can override this. 2. Enter the project details as shown in Figure 4-2.
Quick-start Tutorial • image name. To define the project: 1. Click on the down arrow to specify the Processor Type that you are using to run your images and the toolchain. In this example, that is ARM-ADS. 2. Click the folder icon to open the project base directory, defined previously, and specify the source files to use in the build process. This displays the Select source files for Project dialog box where you can highlight one or more files. Use the Shift or Ctrl keys to select the files dhry_1.
Quick-start Tutorial 4.2.4 Viewing the project settings When you close the Create Standard Project dialog box, RealView Debugger displays the Project Properties window, shown in Figure 4-4. Figure 4-4 Project Properties window The Project Properties window enables you to view project settings as defined in the project file. Click on the entry ...\tutorial.prj at the top of the list of entries in the left pane of the window.
Quick-start Tutorial To do this you must change a project setting: 1. Select Project → Project Properties... from the default Code window main menu to display the Project Properties window. 2. Click on *COMPILE=arm in the left pane to see the contents. 3. Double-click on Preprocessor in the right pane to see the contents. 4. Right-click on Define in the right pane and select Edit Value from the context menu. 5. Type MSC_CLOCK and press Enter.
Quick-start Tutorial 4.2.6 Project base directory When the new project setup is complete, your project base directory is updated with the files required to manage your new project. These are the: • project file tutorial.prj • build target configuration directories Debug, Release, and DebugRel • generated makefiles for each build target configuration, for example tutorial_Debug.mk.
Quick-start Tutorial 4.2.8 Project files The project you have just created is a single-user, self-contained project. This means that the project base directory now contains all the files associated with the tutorial project, as described in Table 4-1. Table 4-1 Tutorial project files Project contains Directory/filename Description Debug directory Debug This area contains the object files and the executable ready for debugging or execution.
Quick-start Tutorial Executable files By default, the executable image created in this project is saved in install_directory\Tutorial\Debug\tutorial.axf. You can copy this file to another location or share it with others in your development team. You can load the image to a target processor without opening the project first. However, where you have created a user-defined project, it is recommended that you open the project first to load and debug the associated image.
Quick-start Tutorial Note If you have loaded the image created by your project, RealView Debugger gives you the option to unload the image. Unload the image associated with the project to avoid the creation of an auto-project (see Working with images on page 4-16 for more details). The Code window title bar shows that the project is no longer open. Any files displayed in the File Editor pane remain after the parent project closes.
Quick-start Tutorial 4.3 Debugging with RealView Debugger This section gives you step-by-step instructions to carry out some basic debugging tasks. These examples use the sample project dhrystone.prj, supplied as part of the RealView Debugger base installation. If you prefer, you can use the executable built in Setting up your first project on page 4-3 and saved in the tutorial project, tutorial.prj.
Quick-start Tutorial 4.3.2 Basic debugging tasks In your debugging session RealView Debugger enables you to examine registers, memory contents, and variables: • Displaying register contents • Changing register contents on page 4-15 • Process control on page 4-16 • Displaying memory contents on page 4-17 • Displaying variables on page 4-19 • Tooltip evaluation on page 4-19 • Using the call stack on page 4-20 • Using browsers and lists on page 4-21 • Setting watches on page 4-21.
Quick-start Tutorial The Register pane displays tabs appropriate to the target processor running your image and the target vehicle used to make the connection. For the ARM7TDMI core using ARMulator, the pane includes the Core tab, showing the base registers for the connected target processor, and the Debug tab, showing internal debugger variables. For full details on the contents of this tab see the chapter describing monitoring execution in RealView Debugger v1.6 User Guide. 2.
Quick-start Tutorial In this example, the value can also be changed by selecting FIQ from the list of values from the context menu shown in Figure 4-6 on page 4-15. Process control To display the Process Control pane: 1. Select View → Pane Views → Process Control Pane from the default Code window. It looks like the example in Figure 4-7. Figure 4-7 Process Control pane The Process tab shows details about your current process.
Quick-start Tutorial An auto-project is a custom, image control, project that holds project settings where the build model is unknown. You can view these settings using the Project Properties window. Using an auto-project enables you to amend and save image load parameters where you do not have a user-defined project or where you have no control over the build model. You also have the option to use the saved auto-project as the basis of a user-defined project.
Quick-start Tutorial Figure 4-9 Updated memory contents Click on the Pane menu again and select Set Number of Columns to show... to choose how many columns are used in the memory display, for example 12. If you do not specify the number used (or specify zero), RealView Debugger displays as many columns as it can fit into the pane. 6. Click the Go button on the Actions toolbar to execute the image. Enter a large number of runs, for example 50000. 7.
Quick-start Tutorial Displaying variables To display the value of a variable from your source code: 1. Select File → Reload Image to Target to reload the image. 2. Click the Go button on the toolbar to execute the image for a number of runs, for example 5000. 3. Select the required variable in the current context, for example click on the file tab for the source file dhry_1.c and move to line 301. Highlight the variable Ptr_Glob in the expression: structassign (*Ptr_Val_Par->Ptr_Comp, *Ptr_Glob); 4.
Quick-start Tutorial Using the call stack The Call Stack pane enables you to follow the flow of your program by examining the current status of functions and variables. This pane shows you the path that leads from the main entry point to the currently executing function. To monitor your execution path: 1. Select View → Pane Views → Call Stack from the default Code window to display the Call Stack pane. 2. Select File → Reload Image to Target to reload the image. 3.
Quick-start Tutorial Using browsers and lists RealView Debugger provides lists browsers and lists to help with debugging tasks. These enable you to search through your source files to look for specific structures and to monitor their status during program execution. Browsers are available for: • project modules and files • functions • variables • C++ classes. To access the browsers: 1. Select Find from the default Code window main menu to display the Find menu.
Quick-start Tutorial 6. Right-click to display the Source Variable Name menu, shown in Figure 4-10 on page 4-19. 7. Select Watch from the menu. This adds the chosen variable to the Watch pane and displays the current value, if known. 8. Click the Go button on the toolbar to execute the image. 9. Click the Stop Execution button to stop the program before it finishes. With the processor halted, monitor changes in the variables in the Watch pane.
Quick-start Tutorial Complex These breakpoints use advanced hardware support on your target processor, or as implemented by your simulator software. Check your hardware characteristics, and your vendor-supplied documentation, to determine the level of support for complex breakpoints. RealView Debugger provides the Set Address/Data Break/Tracepoint dialog box that enables you to specify your breakpoint details and to define how execution continues after the breakpoint triggers.
Quick-start Tutorial 81 }/* Proc_7 */ 4. Right-click on the line number and select Set Break... from the context menu to display the Set Address/Data Break/Tracepoint dialog box shown in Figure 4-12. If the line number is not visible, then right-click inside the gray area at the left of the required statement or on the line of code to display the context menu.
Quick-start Tutorial 9. Click OK to close the Set Address/Data Break/Tracepoint dialog box. The code view is updated and a yellow disc appears to show that a conditional breakpoint has been set. The Cmd tab, in the Output pane, shows the RealView Debugger command used to set the breakpoint. 10. Click the Go button on the toolbar to execute the image.
Quick-start Tutorial You can remove entries from the Break/Tracepoints pane. Highlight the entry and select Clear from the Break/Tracepoint menu. The breakpoints list is refreshed after the entry has been removed. 4-26 Copyright © 2002 ARM Limited. All rights reserved.
Quick-start Tutorial 4.4 Working with custom panes If you are working in single-processor debugging mode, the default Code window gives you full access to your code views and all debugging operations. However, you might want to display multiple memory views for your debug target, or to view multiple panes at the same time. You can customize your desktop to get the views you want.
Quick-start Tutorial Figure 4-14 Example Code window In Figure 4-14, line numbering is turned on by selecting Edit → Editing Controls → Show Line Numbers. 4.4.2 Hiding panes You can use the Pane Management controls, on the Actions toolbar, to define which panes are visible in your Code windows, for example click Hide Bottom Pane from the Pane Management controls to hide the Output pane in the Code window shown in Figure 4-14. 4-28 Copyright © 2002 ARM Limited. All rights reserved.
Quick-start Tutorial 4.5 More about projects This section gives more detail on how to manage your projects in RealView Debugger and enables you to make more changes to the tutorial project, if required. It contains the following sections: • Changing build tools • Viewing build settings on page 4-30 • Adding files to your project on page 4-31 • Generated makefiles on page 4-32 • Building an application on page 4-33 • Finding build errors on page 4-33. 4.5.
Quick-start Tutorial 3. Right-click on the Tool_dir entry and select Edit as Directory Name from the context menu. This displays the Enter New Directory dialog box where you can specify the location of the toolchain you want to use. This forms the base directory for the executable tools for this family of processors. 4. Select File → Save and Close to save your changes and close the Build-Tool Properties window.
Quick-start Tutorial Figure 4-16 Configuration Summary window This window contains one tab for each of the build target configurations specified for the chosen group, that is Debug, Release, and DebugRel. If you change a compiler setting, the Configuration Summary window updates automatically. 5. Click on *ASSEMBLE=arm in the left pane of the Project Properties window to see the ARM assembler (armasm) command line in the Configuration Summary window. 6.
Quick-start Tutorial Note Make sure that the Project Properties window is not open when adding source files from the Project menu. Also ensure that any rebuild is complete. Adding object files to a project If you want to add object files to your project you must use the Project Properties window, shown in Figure 4-4 on page 4-7. For full details of how to do this, see the chapter describing managing projects in RealView Debugger v1.6 User Guide. 4.5.
Quick-start Tutorial Do not make any changes to the generated makefiles as these are overridden when the files are next generated. It is recommended that you always use the Project Properties window to set up your preferences. 4.5.5 Building an application To build the executable for a project: 1. Select Project → Open Project... to open the required project. 2. Select Tools → Build... from the default Code window main menu. 3.
Quick-start Tutorial • • places a blue pointer at the error places the flashing text cursor in the source file after the error. If RealView Debugger finds more than one error, it highlights the first error. Select Tools → Next Line/Error to move through the error list after correcting an error. Alternatively, you can go directly to an error by double-clicking on the line number, shown in the Output pane Build tab. 4-34 Copyright © 2002 ARM Limited. All rights reserved.
Quick-start Tutorial 4.6 Completing the tutorial Because the tutorial project is self-contained, follow these steps if you want to tidy up the install_directory\Tutorial directory after you close down RealView Debugger. 4.6.1 Removing tutorial project files To remove the files associated with the project: 1. Delete the project file install_directory\Tutorial\tutorial.prj. 2. Delete the build target configuration directories, for example: install_directory\Tutorial\Debug 3.
Quick-start Tutorial 4-36 Copyright © 2002 ARM Limited. All rights reserved.
Chapter 5 Ending your RealView Debugger Session This chapter describes how to end your debugging session and how to exit RealView Debugger. It contains the following sections: • Saving the session on page 5-2 • Disconnecting from a target on page 5-5 • Exiting RealView Debugger on page 5-7. ARM DUI 0181B Copyright © 2002 ARM Limited. All rights reserved.
Ending your RealView Debugger Session 5.1 Saving the session RealView Debugger stores session details by default when you end your debugging session. Saving the session enables you to start your next session using the same working environment, connecting automatically to a specified target, and opening projects. RealView Debugger stores session details using your: • Workspace • Startup file on page 5-3 • History file on page 5-3 • Settings options on page 5-4. 5.1.
Ending your RealView Debugger Session For full details on amending your workspace settings to define how session details are saved and where, see the chapter describing configuring workspaces in RealView Debugger v1.6 User Guide. 5.1.
Ending your RealView Debugger Session 5.1.4 Settings options By default, RealView Debugger writes your current settings to your startup file ready for re-use, saves your current workspace, and reloads this workspace at the next start-up. To change these defaults, select File → Workspace from the main menu to display the Workspace menu shown in Figure 5-1 on page 5-2. At the bottom of this menu are your current settings options.
Ending your RealView Debugger Session 5.2 Disconnecting from a target You can disconnect from the current target quickly, depending on your current debugging mode. Either: • Select File → Connection → Disconnect from the Code window main menu. This immediately disconnects the connection. • Select File → Connection → Connect to Target... from the Code window main menu to display the Connection Control window, and unselect the check box to disconnect the connection.
Ending your RealView Debugger Session If you set disconnect mode from the Connection Control window, this temporarily overrides any setting in your target configuration file. See the chapter describing connecting (and disconnecting) in RealView Debugger v1.6 Target Configuration Guide for full details on setting disconnect mode for your debug target. 5-6 Copyright © 2002 ARM Limited. All rights reserved.
Ending your RealView Debugger Session 5.3 Exiting RealView Debugger This section describes the options available when you exit RealView Debugger: • Closing down without a connection • Closing down with a connection • Reconnecting to a target on page 5-8. 5.3.1 Closing down without a connection Disconnect from your target, as described in Disconnecting from a target on page 5-5, and select File → Exit to display the Exit dialog box. Click Yes to close the Exit dialog box and close down RealView Debugger.
Ending your RealView Debugger Session Terminating the connection To close down and terminate the connection: 1. Leave the Disconnect Connection check box, shown in Figure 5-2 on page 5-7, so that it is selected. 2. Click Yes to close the Exit dialog box and close down RealView Debugger. RealView Debugger exits and terminates any connections to debug targets, that is TVS stops.
Chapter 6 RealView Debugger Desktop This chapter describes, in detail, the RealView Debugger desktop. It describes the contents of the default Code window, and explains how to change them. This chapter describes items and options available from the main menu and the toolbars.
RealView Debugger Desktop 6.1 About the desktop This section describes the default Windows desktop that you see when you run RealView Debugger for the first time after installation and highlights any key features that might be different. It contains the following sections: • Splash screen • Code window • Default windows and panes on page 6-5 • Pane controls on page 6-8 • Button toolbars on page 6-8 • Color Box on page 6-9 • Other window elements on page 6-10. 6.1.
RealView Debugger Desktop Color Box Title bar Toolbars Pane Management controls Build controls Processor State Side pane File Editor pane Output pane Pane title bar Status line Command line Cursor location field Keyboard status Figure 6-1 Default Code window The Code window is your main debugging and editing window. The contents of this window change as you: • connect to targets • load and unload application programs or files • configure and customize your working environment.
RealView Debugger Desktop Figure 6-2 Title bar In addition to the application icon, the title bar contains (from left to right): RVDEBUG Identifies the Code window. This changes as you open new windows, for example RVDEBUG_1, or RVDEBUG_2. (dhrystone) The project associated with the image that you loaded. In RealView Debugger, a project can be associated with a connection, that is it is bound to that connection, shown in Figure 6-2.
RealView Debugger Desktop 6.1.3 Default windows and panes RealView Debugger provides a range of debug views: • Registers • Stack • Process Control • Symbol Browser • Watch • Call Stack and Locals • Memory and Memory Map • Threads (with the appropriate RTOS support package) • Break/Tracepoints. The default Code window, shown in Figure 6-1 on page 6-3, contains: File Editor pane The File Editor pane is always visible when working with RealView Debugger.
RealView Debugger Desktop If you load an image, or when you are working with source files, more tabs are displayed, for example dhry_1.c. In this case, click on the Src tab to see the location of the PC. Side pane By default, this contains the Register pane view that displays grouped processor registers for the current target processor.
RealView Debugger Desktop Memory pane Use this pane to: • display the contents of a range of memory locations on the target • edit the values stored by the application. Bottom pane The bottom pane of the Code window always contains the Output pane.
RealView Debugger Desktop 6.1.4 Pane controls Each configurable pane in the Code window, shown in Figure 6-1 on page 6-3, includes a title bar and pane controls. In the side pane, the pane title bar is displayed horizontally at the top of the pane. In the middle and bottom panes, the title bar is displayed vertically at the left side of the pane. If you float a pane, the title bar is displayed horizontally at the top of the window.
RealView Debugger Desktop Figure 6-3 Actions toolbar Figure 6-4 Editing toolbar To disable a toolbar, select View → Toolbars from the main menu. This displays the Toolbars menu where you can specify which toolbars are visible. You can move a toolbar from the default position in the Code window so that it floats on your desktop. To restore the floating toolbar, double-click anywhere on the toolbar title bar. Note Repositioning a toolbar in this way applies only to the calling Code window.
RealView Debugger Desktop When you first start RealView Debugger the Code window is not associated with any target or process. The Color Box changes when you make your first connection. As you create new Code windows, these are also color-coded. Closing your connection changes the Color Box to show that there is no connection associated with the window. Any other Code windows attached to that connection are also updated to match.
RealView Debugger Desktop 6.2 Finding options on the main menu This section provides a summary of the main menu options available from the Code window that enable you to: • open and close files within the File Editor pane • manage target images, projects, and workspaces • navigate, search, and edit source files • manage new windows and change pane contents • work with projects and build images • debug your images • access the online help system.
RealView Debugger Desktop Edit Displays the Edit menu shown in Figure 6-7. This menu enables you to work with source files as you develop your application. It includes options to define how source code is displayed in the File Editor pane. Figure 6-7 Edit menu Find Displays the Find menu shown in Figure 6-8. This menu enables you to work with source files and to perform searches on those files as you debug your image. This also gives access to the browsers in RealView Debugger.
RealView Debugger Desktop Note Custom windows are not available in this release. Project Displays the Project menu shown in Figure 6-10. This menu enables you to work with projects so that you can organize your source files, model your build process, and share files with other developers. This can be used in conjunction with the Tools menu to rebuild images. Figure 6-10 Project menu Tools Displays the Tools menu shown in Figure 6-11.
RealView Debugger Desktop Debug Displays the Debug menu shown in Figure 6-12. Figure 6-12 Debug menu This menu includes the main facilities you use during a debugging session. Help Displays the Help menu shown in Figure 6-13. Figure 6-13 Help menu This menu gives you access to the RealView Debugger online help, to web downloads pages, and displays details of your version of RealView Debugger. You can also use this menu to create and submit a Software Problem Report (SPR).
RealView Debugger Desktop 6.3 Working with button toolbars The Code window toolbars give access to many of the features available from the main menu and to additional debugging controls. By default, the Code window shows both toolbars but you can customize which controls are available. This section describes: • Actions toolbar • Editing toolbar on page 6-16 • Customizing the Actions toolbar on page 6-17. 6.3.
RealView Debugger Desktop Used during a multiprocessor debugging session, click this button to connect to the next available active connection. Click on the drop-down arrow to display the list of active connections with the current connection marked with an asterisk. The list also shows if the Code window is attached by adding a check mark. Threads button Used during a multithreading debugging session, click this button to change to the next active thread.
RealView Debugger Desktop Find: This field enables you to perform a quick text search on the file currently displayed in the File Editor pane. Type the required string into the Find field and then press Enter. If you are working on several files in the File Editor pane, the search examines only the file in the topmost file tab. Click on the drop-down arrow to display a list of recently-used search strings.
RealView Debugger Desktop If you customize a toolbar, this persists to any new Code windows that you open from this calling window. However, you cannot customize the toolbars shown in a standalone Editor window (see Editor window on page 6-22). Note Custom toolbar groups are not available in this release. 6-18 Copyright © 2002 ARM Limited. All rights reserved.
RealView Debugger Desktop 6.4 Working in the Code window This section describes how to work with the Code window: • Floating, docking, and resizing windows and panes • Changing the focus • In-place editing on page 6-20 • Working with tabs on page 6-21. 6.4.1 Floating, docking, and resizing windows and panes Panes are docked to default positions in the Code window when RealView Debugger starts in the default state. You can resize the middle pane row by dragging the upper boundary to the required height.
RealView Debugger Desktop If you double left-click in a pane entry, for example on the contents of a register in the Register pane, this moves the focus to this pane and highlights the entry ready for editing. If you right-click in a pane that does not have the focus, the focus does not move to this pane. This action does, however, highlight the chosen entry in the new pane. In this case, use the Code window title bar to see where the focus is currently located. 6.4.
RealView Debugger Desktop 6.4.4 Working with tabs You can access RealView Debugger debugging features using tabbed pages or tabs. In the Watch pane, for example, there are multiple tabs and each shows a different set of watched variables. The Output pane contains tabs enabling you to select the view that suits your debugging task. Right-click on a tab to display text that explains the function of the tab or the content.
RealView Debugger Desktop 6.5 Editor window RealView Debugger includes a range of editing features to help you work with source code and projects. Use a standalone Editor window to access these editing features so that you can edit files independently of the debugging session or to include these files within your project. To display a standalone Editor window, select View → Editor Window from the Code window main menu. This displays a floating Editor window shown in Figure 6-15.
RealView Debugger Desktop 6.6 Resource Viewer window The Resource Viewer gives access to all the debugger resources as your debugging session progresses. With the appropriate OS support package, the Resource Viewer window also gives access to RTOS resources including lists of timers, threads, queues, event flags, and memory in byte and block pools. In this mode, additional tabs are displayed.
RealView Debugger Desktop 6.6.1 File menu This menu contains: Update List Rereads the board file and updates the items displayed in the Resources list. This might be necessary if you change your connection without closing the Resource Viewer window. Display Details Displays details about a selected entry in the Resources list. A short description is shown in the Details area in the window. You can also display details about an item by double-clicking on the entry in the Resources list.
RealView Debugger Desktop 6.6.3 Resources list The Resources list box displays all the resources available to RealView Debugger. In single-processor debugging mode, it contains only the Conn tab showing the connection. In multiprocessor debugging mode, the Conn tab shows all active connections. An asterisk (*) indicates the current connection. If you are debugging a multithreaded application, the Resources list box displays a series of tabs, see the chapter describing RTOS support in RealView Debugger v1.
RealView Debugger Desktop 6.7 Analysis window RealView Debugger includes Trace, Analysis and Profiling for use when debugging either single targets or multiple processes. If you have a Trace license, the Analysis window gives you access to these features. You can set tracepoints for a trace capture from the Code window and then use the Analysis window to view and analyze the results of the capture.
Appendix A Configuration Files Reference This appendix describes the files set up for a new installation of RealView Debugger v1.6, where they are stored, and what information each file holds. This appendix assumes that you have chosen a Typical installation. It contains the following sections: • Overview on page A-2 • Files in the etc directory on page A-3 • Files in the home directory on page A-5. ARM DUI 0181B Copyright © 2002 ARM Limited. All rights reserved.
Configuration Files Reference A.1 Overview RealView Debugger v1.6 creates files containing default settings and target configuration information when you first install. The files created (or modified) depend on whether you have chosen a Typical installation or a Custom installation. If you are upgrading from an earlier version of RealView Debugger, some files are modified so that previous configuration information is not lost.
Configuration Files Reference A.2 Files in the etc directory When you install RealView Debugger v1.6, files containing default settings and target configuration details are installed in install_directory\etc. What files are installed, and their contents, depend on what other software is detected during the installation, for example ADS 1.2: armul.var A list of ARMulator variants used by RealView Debugger. You can edit this file to add hand-made variants.
Configuration Files Reference Do not edit this file manually. template.spr SPR template used by RealView Debugger. Do not edit this file manually. *.bcd Board/chip definition files supplied by hardware manufacturers. If you want to make changes to these files, copy them into your default home directory and edit them using the Connection Properties window. *.jtg JTAG configuration files for non-RDI targets. *.stp RealView Debugger internal template files containing debugger defaults.
Configuration Files Reference A.3 Files in the home directory When you install and run RealView Debugger v1.6 for the first time, files containing default settings and target configuration details are copied into your RealView Debugger default home directory where they can be maintained. If you are upgrading from an earlier version of RealView Debugger, the installer creates the home directory and copies your existing configuration details into it.
Configuration Files Reference *.bcd Board/chip definition files that you might have copied into your home directory, from install_directory\etc, to make changes. Making copies means that the installation files are not changed. *.cnf These are default target configuration settings files that are created when you first run RealView Debugger, for example armulator.cnf. These files are referenced by the .rbe files. *.rbe A.3.1 There is one .
Glossary The items in this glossary are listed in alphabetical order, with any symbols and numerics appearing at the end. Address breakpoint A type of breakpoint. See also Breakpoint. ADS See ARM Developer Suite. Angel Angel is a software debug monitor that runs on the target and enables you to debug applications running on ARM-based hardware. Angel is commonly used where a JTAG emulator is not available.
Glossary AXYS Oak simulator The AXYS Oak MaxSim simulator provides a high-end hardware/software model for the Oak DSP Core from the DSP Group Inc. It is available from the RealView Debugger Connection Control window if an Oak DSP license has been obtained. Backtracing See Stack Traceback. Big-endian Memory organization where the least significant byte of a word is at the highest address and the most significant byte is at the lowest address in the word. See also Little-endian.
Glossary Hardware breakpoint A breakpoint that is implemented using non-intrusive additional hardware. Hardware breakpoints are the only method of halting execution when the location is in Read Only Memory (ROM). Using a hardware breakpoint often results in the processor halting completely. This is usually undesirable for a real-time system. See also Breakpoint and Software breakpoint. IEEE 1149.1 The IEEE Standard that defines TAP. Commonly (but incorrectly) referred to as JTAG.
Glossary RealView Compilation Tools RealView Compilation Tools is a suite of tools, together with supporting documentation and examples, that enables you to write and build applications for the ARM family of RISC processors. RealView Debugger Trace A software product add-on to RealView Debugger that extends the debugging capability with the addition of real-time program and data tracing.
Glossary Software Interrupt (SWI) An instruction that causes the processor to call a programmer-specified subroutine. Used by the ARM standard C library to handle semihosting. Stack traceback Also called a stack backtrace, this a list of procedure or function call instances on the current program stack. It might also include information about call parameters and local variables for each instance. SWI See Software Interrupt. TAP See Test Access Port.
Glossary TVS See Target Vehicle Server. Watch A watch is a variable or expression that you require the debugger to display at every step or breakpoint so that you can see how its value changes. The Watch pane is part of the RealView Debugger Code window that displays the watches you have defined. Word A 32-bit unit of information. Glossary-6 Copyright © 2002 ARM Limited. All rights reserved.
Index The items in this index are listed in alphabetical order, with symbols and numerics appearing at the end. The references given are to page numbers.
Index Main menu 6-11 NUM 6-10 pane controls 6-8 panes 6-5 Resource Viewer 6-23 Status line 6-10 STDIOlog 6-10 title bar 3-12, 6-3 windows and panes 6-5 Color Box 6-9 Comments on documentation xi on RealView Debugger xi Concepts debug target 1-2 DSP 1-2 multithreading 1-3 RTOS 1-2 Concepts and terminology 1-2 see also Glossary Connect mode 3-6 Connecting 3-4, 3-5 and close down 5-7 RDI details 3-6 Connection Broker Local mode 1-5 Remote mode 1-5 Connection Control window managing connections 3-5 Create New
Index on documentation xi on RealView Debugger xi File Editor File Editor pane 6-5 Files adding to projects 4-31 armul.var A-3 board file 1-4, 3-4 board-chip definition 1-4 configuration A-3 genmake.loc A-3 genmake_ARM_ADS.loc A-3 gen_arx.mk A-3 installed in \etc A-3 installed in \home A-5 pARM.prc A-3 project 4-10 rvdebug.brd A-3 rvdebug.tpl A-3 startup.mk A-3 targ_ARM.aco A-3 template.spr A-4 *.auc A-5 *.aws 3-2, 5-2, A-5 *.axf 3-10, 4-11 *.bak 4-11, A-6 *.bcd 1-4, A-4, A-6 *.brd 1-4, 3-4, A-3, A-5 *.
Index binding 4-11 bound 6-4 build errors 4-33 build tools 4-4, 4-29 building applications 4-9 closing projects 4-11 compiler options 4-7, 4-8 compiler settings summary 4-30 files 4-10 generated makefiles 4-32 getting started 4-3, 4-29 linker settings summary 4-30 new projects 4-3 properties 4-7 unbound 6-4 Q Queries xi R RDI connection details 3-6 Real Time Operating Systems 1-2 RealView Debugger closing down 5-7 Code window 3-2, 6-2, 6-3 components 1-4 concepts 1-2 connecting to a target 3-4 debug targ
Index setting watches 4-21 using browsers 4-21 using the call stack 4-20 using tooltip evaluation 4-19 U Unloading images 3-13 V Views code 3-15 W Watches 4-21 Who should read this book vi Windows Analysis 6-26 attachment 3-12, 6-4 Build-Tool Properties 4-4 Code 3-2 Configuration Summary 4-30 Connection Control 3-4 docking 6-19 Editor 6-22 floating 6-19 focus 6-19 Project Properties 4-7 Resource Viewer 6-23 Workspace connection details 5-5, 5-7, 5-8 saving 5-2 ARM DUI 0181B Copyright © 2002 ARM Limite
Index Index-6 Copyright © 2002 ARM Limited. All rights reserved.