
Technical data


2
2 - 8
Design of Mini Multiset
1. Model Selecting and Capacity Calculator
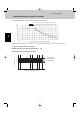
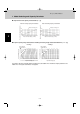
■ Graph of indoor unit capacity characteristics (2 – (1))
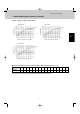
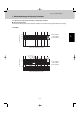
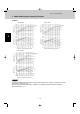
■ Graph of capacity change characteristics resulting from tubing length and elevation difference (1 • 2 – (2))
Rate of cooling capacity change (%)
Indoor unit cooling capacity characteristics Indoor unit heating capacity characteristics
indicates the rating point. indicates the rating point.
Indoor air intake temp. (°C WB)
Rate of heating capacity change (%)
Indoor air intake temp. (°C DB)
120
110
100
90
80
110
105
100
95
90
14 15 16 17 18 19 20 21 22 23 24 25 15 16 17 18 19 20 21 22 23 24 25 26
27
100
%
98
96
94
92 90 88 86 84 82 80 78 76
0 10 20 30 40 50 60 70 80 90 100 110 120 130 140 150
<Cooling>
Base capacity
change rate (%)
Elevation difference (m)
Equivalent len
g
th (m)
50
40
30
20
10
0
-10
-20
-30
-40
97 96 95 94 93 92 91
0 10 20 30 40 50 60 70 80 90 100 110 120 130 140 150
<Heating>
Base capacity
change rate (%)
Elevation difference (m)
Equivalent len
g
th (m)
50
40
30
20
10
0
-10
-20
-30
-40
98
99
100
%
The positive side for the elevation difference indicates that the outdoor unit is installed at a higher position than the
indoor units. The negative side indicates the opposite.