
User's Manual

FutureWaves™ User Manual
FutureWaves™ v1.7.0.1
24
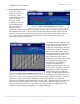
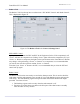
Data & Trends
The
Data & Trends
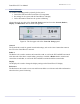
panel is used to display measured parameters and their trends. This is
displayed in Figure 25. Three of the listed parameters can be plotted. Max values over a two-
minute window are depicted by the red line and the white line depicts the two-minute average of
the single significant amplitude (SSA).
Figure 25:
Data & Trends
panel
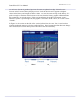
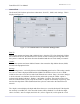
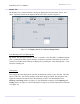
Note that some of the columns do not have data entries. This may happens if a trend was not
recorded at the exact time specified in the column header. However, if you display the parameter
on the graph you will see that the system does in fact have a 24-hour trend associated with that
parameter.
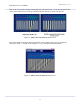
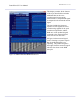
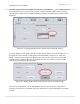
To add or replace a graph with a new measured parameter:
1.
Select the X-Y plot that will contain the information
2.
Click on the table row containing the desired parameter.
All of the currently available history for the selected parameter will appear in the graph.