
User's Manual

FutureWaves™ User Manual
FutureWaves™ v1.7.0.1
23
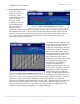
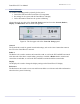
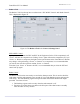
This display contains all the features
of those just described but includes
additional data on the cross-
correlation and average-angle
measurements of the predicted signal
as compared to the measured motion
signal.
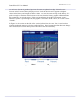
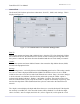
The plots include the frequency
response of both signals, the cross-
correlation lag applied for the peak
correlation computation, and the
RMS ratio of the predicted signal
compared to the measured signal
across the forecast time line.
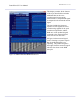
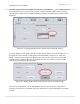
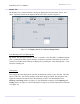
In Figure 24 the measured signal
(red) is showing a response in pitch
that the predicted signal is not
capturing. The predicted signal is
also higher than the measured signal
which is also shown in the RMS
ratio plot.
Figure 24:
Micro-Forecast Panel
Maximized