
User's Manual

FutureWaves™ User Manual
FutureWaves™ v1.7.0.1
22
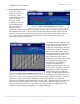
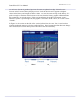
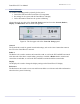
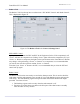
This can be very useful in seeing a timing-lag issue with the forecast. As the time progresses the
‘zebra’ lines will march in to line up with the measured motions as shown in Figure 22.
Figure 22:
Micro-Forecast Panel
Example Part 4
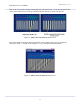
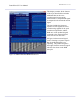
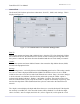
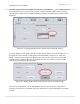
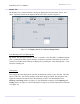
Even more detailed signal-processing information can be displayed in a pop-out window by
clicking the large ‘+’ circled in red in Figure 23 or by clicking the maximize button.
Figure 23:
Micro-Forecast Panel
Example Part 5