
User's Manual

FutureWaves™ User Manual
FutureWaves™ v1.7.0.1
18
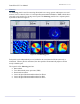
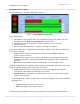
Operational Forecast Panel
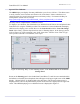
The Operational Forecast Panel is displayed in Figure 17.
Figure 17:
Operational Forecast Panel
User settings include:
Thresholds for Wave Height, Heave, Pitch, and Roll at origin point (usually CG). The
thresholds represent
peak-to-peak amplitude
of the parameter.
Minimum Operation Time needed to perform an operation (e.g. a crane lift)
Confidence Level
Roll-up of threshold parameters to consider for Go/No-Go condition
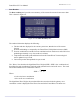
In the above example Wave Height and Pitch are being ‘rolled-up’ to provide the conditions for
the Go/No-Go stoplight.
Green
indicates no limits (thresholds) are currently exceeded
and
the Minimum
Operating Time is also met.
Yellow
can only follow a Green condition and indicates that parameters are still below
thresholds but that there is less than the Minimum Operating Time left to complete the
operation
Red
indicates a threshold is exceeded and the number of seconds until it clears.
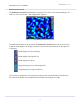
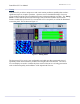
The Roll-Up and Forecast bars indicate similar conditions. The numbers in the bars represent the
number of seconds (length) of this section of the forecast bar.
Green
indicates no limits exceeded at the bar forecast time
and
no expected limits
exceeded for at least Minimum Operating Time seconds.
Dark Red
indicates a threshold is exceeded and the number of seconds the threshold is
expected to be exceeded.
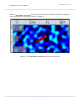
If a threshold is
not
currently exceeded, but it’s expected to happen in less than the Minimum
Operating Time:
o
Yellow
if this happens after a green section.
o
Red
if this happens after a dark red section.
The Roll-Up is the combination of the selected (check-boxes on the left) forecast parameters.