
User's Manual

FutureWaves™ User Manual
FutureWaves™ v1.7.0.1
14
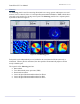
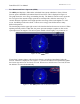
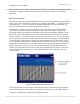
Two Dimensional Power Spectrum (2DPS)
The
2DPS
panel displays a 2DPS either calculated from current radar data or from a NOAA
forecast spectra obtainable by download from NOAA NCEP. This is displayed in Figure 12.
The graph shows the wave energy surrounding the ship. The distance from the center represents
the wave period: the outermost edge represents 4 second periods, while the inner ring is 27
seconds. Whereas significant wave height provides an average value for the highest 1/3 of all
waves, the 2DPS provides more detail. It shows wave energy from all directions at many
different frequencies.
The time displayed in the upper right corner is the time that the last forecast was received. When
updating normally with live radar data, the power spectrum attempts to update as often as the
system processor can support. The current system should refresh roughly every minute or so.
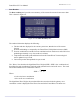
Figure 12: The
2DPS
panel
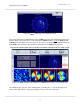
If more than 3 minutes elapses without a fresh forecast, an indicator immediately below the
forecast valid time is displayed (view Figure 13). The time late indicator will periodically update
the forecast age until a new forecast is received. When a new valid forecast is received, the time
late indicator is removed automatically.
Figure 13: The
2DPS
panel with an old time indicator