
System information


142 Chapter 9 Managing Server Information
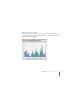
Here are ways you can use the Graphs pane:
m Choose a type of activity and a time period from the pop-up menus.
Processor Usage: Monitor the workload of the server’s processor or processors (also
called the central processing unit, or CPU).
Network Traffic: Track how much incoming and outgoing data the server transfers over
the network.
Disk Space: See how much space is used and available on each mounted disk or
volume (partition).
File Sharing Traffic: Track how much incoming and outgoing data the file sharing
services transfer over the network.
Web Traffic: Track how much incoming and outgoing data the web services transfer
over the network.
You can also monitor server activity using the Server Status widget on the server or on
another computer on the network. For information, see “Using the Server Status
Widget” on page 49.
If the server has a display, you can use Activity Monitor (located in /Applications/
Utilities/) on the server. Activity Monitor shows the processes and applications that are
currently open on the computer. You can also use Activity Monitor to monitor short-
term processor workload, disk activity, and network activity. For information about
using Activity Monitor, open it and then use the Help menu.