
User guide

32i>clicker User Guide Windows/PC
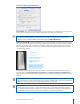
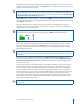
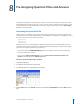
Conrmed Receipt and Vote Selection displays both the students i>clicker remote ID and a dierent
color depending on their last received response. In the grid below, A is yellow, B is Blue, C is purple, D is
red, and E is green. The student with remote ID 11617 answered B for this question, while students with
remotes EF0FE and 13637 answered C.
TIP: During polling, your students can freely change their votes at any time until you select STOP
(their last vote is recorded). Students may use the color coding in this Vote Selection grid to quickly
identify the most popular answer and change their vote in response. This behavior could both skew
your question data and also impact your performance points assignments. If you are assigning
performance points for a correct answer in your sessions, you may not want to choose the Conrm
response was received and show response choice option.
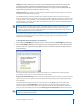
Results Chart: During polling, a graph displays the results of each question in your session. The graphs
can be displayed by clicking the Display button on the i>clicker oating menu bar or using B on the
Instructor’s Remote. This setting allows you to select whether the graph should be displayed as multi-
color or monochrome.
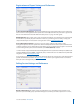
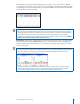
TIP: For either display option, if you designate a correct answer choice and display the graph, the bar
will appear in green and the remaining bars will turn red. See the example below (the left example is
the multi-colored version without a correct answer designated; the right example is the same
multi-colored version with a correct answer of C).
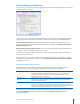
To return the graph to the default multicolored mode, mouse over the graph so that the answer
choices appear and select the ?, or if you are using the Instructor’s Remote function to toggle a
correct answer, toggle through all options until the graph returns to multicolored.