
User guide
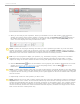

answer is also deleted from i>grader and no point adjustments will occur.
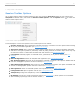
4. To display data for the previous question, click Previous button. To display data for the next question,
click the Next button .
5. To change the chart type, click the Chart Type button and select a chart type from the drop-down
menu.
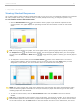
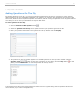
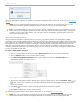
6. Numeric Results Charts: For numeric questions, you have the option of viewing the results as a vertical
bar chart (default) or a histogram. Click the Chart Type button to change the chart type. When viewing
a vertical bar chart, you can click the Significant Digits button to select the number of significant digits
to display on the chart. By changing the significant digits, you can group student responses.
Numeric bar chart with 3 significant digits selected
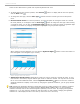
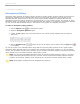
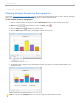
When viewing a numeric histogram, you can click the Significant Digits button to select the number of
bins that appear in the histogram (up to 10 bins).
Numeric histogram with 5 bins selected
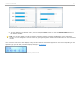
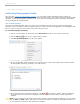
7. Alphanumeric Results Charts: Alphanumeric results can only be viewed as a vertical bar chart. To view
more results in the window, drag the bottom right corner to resize the window. You may also use the scroll
bar to view results additional results. Click the Significant Characters button to select the number of
significant characters to display on the chart. By changing the significant characters, you can group student
responses.
TIP: Changing the significant characters is particularly useful for ranking questions. For example, 3 students
provide the following answers to a ranking question ABCDE, ABEDC, BCEDA. With 5 or more significant
characters selected, each of these answers appears separately in the bar chart. By changing the significant
characters to 1, you can group the students by their first choice. In this example, changing the significant
characters to 1 will display two bars on the chart (2 votes for A and 1 vote for B).
i>clicker v6.1 User Guide 43