
User guide

3 - Using i>clicker in the Classroom
Viewing Student Responses
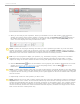
The i>clicker Session Toolbar includes a Results Chart that you can use to view your students' responses in a horizontal
bar chart (multiple choice only), vertical bar chart, pie chart (multiple choice only), or histogram (numeric only).
To view student results in the Results Chart:
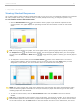
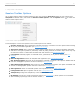
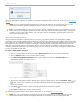
1. Click the Results Chart button on the toolbar to show a graph of your students’ responses for the
current question. The graph displays the percentage of total votes and number of votes for each answer
choice.
i>clicker Results Chart
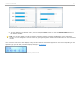
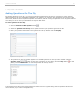
TIP: You may also display two graphs, the current graph and any previous graph, side-by-side by clicking on
the Compare button in the Results Chart window. The second graph will display above your current graph.
You may select the Previous or Next buttons to toggle between graphs in choosing your second graph to
display.
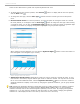
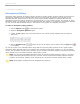
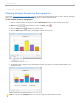
2. To designate a correct answer, click the Correct Answer button on the Results Chart. The Correct
Answer window displays. Click the checkbox next to the correct answer and click Apply. After you have
designated a correct answer, the correct answer choice on the Results Chart turns green.
Results Chart showing Correct Answer window menu and the correct answer C
NOTE: The green and red color values in the Results Chart were selected using Color Universal Design (CUD)
which ensures that graphical information is conveyed accurately to people with various types of color vision,
including people with color blindness.
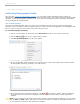
3. To clear the correct answer, click the Correct Answer button and click Clear on the Correct Answer
window.
TIP: When you designate a correct answer on the results chart, it is saved into i>grader. If you have chosen to
award students points for correct answers, all points will be adjusted accordingly. If you select a correct answer
on the chart and then click the Clear button to clear the selection and return to the default chart, the correct
i>clicker v6.1 User Guide 42