
User guide

appear in the students' responses. For example, The response 21111 with significant figures set to 2 would
appear as 21000.
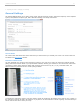
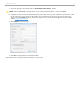
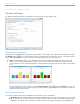
Histogram: The histogram chart displays the student responses in a histogram. Use the Number of bins
drop-down menu to adjust the number of vertical bars that appear in the histogram. You may also choose to
show the mean and standard deviation.
NOTE: You may also change the numeric response chart type, the significant figures, and the number of bins
while viewing the student responses by clicking their buttons on the Results Chart during your polling sessions.
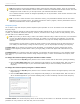
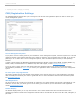
Alphanumeric Response Charts
Alphanumeric responses are displayed as a vertical bart chart with the responses sorted by most to least popular. Use
the scroll bar to view all of the answers. Click the drop-down menu to select the default Number of significant
characters that are displayed in the results chart. Changing the significant characters will adjust the number of
characters that appear in the students' responses. For example, The response CHEMICALS with significant characters
set to 4 would appear as CHEM.
TIP: Unless you know that your correct answers will never exceed a certain number of characters, it is
recommended that you keep the significant characters default set at 16. You can always decrease the number of
significant characters while viewing the student responses in the results chart.
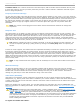
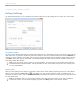
Correct Answer Display
This options controls whether or not correct answers are automatically displayed after you stop polling. The option only
applies if you have pre-selected correct answers using the Question List Editor. You may also override the default
setting for specific questions using the Question List Editor.
i>clicker v6.1 User Guide 20