
User guide

2 - Preparing for Class > Changing your Settings
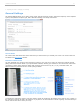
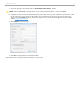
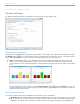
Results Settings
The Results Settings allows you to customize the results charts for each question type.
Results tab in My Settings window
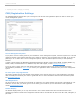
Multiple Choice (A-E) Results
During polling, a graph displays the results of each question in your session. The graphs can be displayed by clicking
the Results button on the i>clicker Session Toolbar or pressing B on the instructor's remote. The Multiple choice
(A-E) results options allow you to select whether the chart displays as Color or Monochrome.
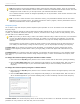
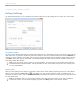
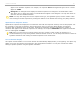
TIP: For either display option, if you designate a correct answer choice and display the chart, the bar will
appear in green and the remaining bars will turn red. See the example below (the left example is the color
version without a correct answer designated; the right example is the same color version with a correct answer
of C).
Results Chart with no correct answer selected and with a correct answer selected
To stop displaying the correct answer, click the Correct Answer button and select <None>, or if you are
using the instructor's remote function to toggle a correct answer, toggle through all options until the graph no
longer shows the correct answer.
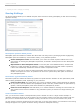
Numeric Response Results
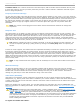
The numeric response chart can be displayed as a vertical bar chart or a histogram
Bar Chart: The bar chart displays all of the student respones sorted by most to least popular. Use the scroll
bar to view all of the answers. Click the drop-down menu to select the Number of significant figures that are
displayed in the results chart. Changing the significant figures will adjust the number of figures/digits that
i>clicker v6.1 User Guide 19