
User guide


User Guide InfraStruxure 150kVA Power Distribution Unit 62
Home Page
Overview
On the Home tab, displayed when you log on to the Web interface, you can view active alarm conditions
and the most recent events recorded in the event log.
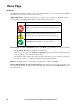
Quick status icons. At the upper right corner of every page, one or more icons indicate the current
operating status of the PDU and the number of active alarms of that severity:
Active alarms. The Power Distribution section of the Home page summarizes the status of the PDU:
• The No Alarms Present icon displays if no alarms exist.
• One or both of the other icons (Critical and Warning) display if any alarms exist, and after each
icon, the number of active alarms of that severity.
• The input and output voltages, the supported load, and the active power provided for each phase.
• The bypass voltages, if your PDU model includes a Bypass Input Switch
Note: Click a quick status icon on any page of the interface to return to the Home.
Recent System Events. The Recent System Events section displays, in reverse chronological order,
the events that occurred most recently and the dates and times they occurred. Click More Events to view
the entire event log.
Icon Description
Critical: A critical alarm exists, which requires immediate action.
Warning: An alarm condition requires attention and could
jeopardize your data or equipment if its cause is not addressed.
No Alarms Present: The PDU is operating normally.