
User Manual
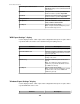

Icon Description
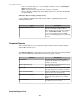
Use this Zoom Out icon to view the graph
in less detail.
Use this Summary Data icon to view a
summary-format version of a selected
report.
Use this Table Data icon to view a table-
format version of a selected report.
Use this Trend Line icon to view a linear
trend line for the same time period as the
data, on numeric sensors only, when all
numeric sensors included in the graph use
the same unit of measure.
Use this Refresh icon to select how often
reports will refresh.
Use this Save icon to name a report and
save it in the Saved Reports section of
the Available Reports view.
Note: An asterisk (*) preceding the report
name indicates the report has not been
saved.
Use this Export icon to save a copy of a
report to the local drive.
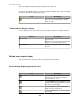
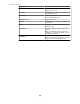
Sensor History Report table-format and summary-format report icons
These report views share two icons and Go to arrow icons you can use to browse through
a multiple-page report, with a box that identifies the page being viewed.
Icon Description
Use this Edit Report Criteria icon to edit
the time frame or sensors you want a
selected report to cover.
Use this Save icon to name a report and
save it in the Saved Reports section of
the Available Reports view.
Note: An asterisk (*) preceding the report
name indicates the report has not been
saved.
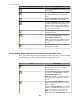
Use this Save Copy of Graph icon for a
graph-format report to save it as a *.bmp,
*.jpg, or *.png file.
Use this Save Report Data icon for a table-
format or summary-format report to save a
copy of the report as a .*txt or *.csv file.
Note: You must use the chevron icon
included with this Save Report Data icon in
StruxureWare Central 6.3.0
123