
User Manual

This view displays Snapshot Reports and allows you to export it.
You can use the Go To arrow icons to browse through a multiple-page report, along with
the box that identifies the page being viewed.
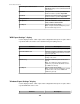
Icon Description
Use the chevron icon included with this Export
icon to save the selected report as *.HTML,
*.CSV, or *.PDF.
"Choose Device Groups" display
Use this display to choose the device groups you want to include in a Snapshot Report.
Element Description
Device Group
Check-mark the groups you want to include in the
report selected
Note: All device groups, and the Select/Deselect
All option, are check-marked by default.
Generate Report
Click to render the report for the device groups
selected.
Button icons (report views)
The report views have icons you can use to perform various functions.
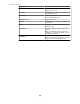
Sensor History Report graph-format icons
Icon Description
Use this Edit Report Criteria icon to edit
the time frame or sensors you want a
selected report to cover.
Use this Marker icon to highlight the point
for which data is displayed when you move
the cursor over the graph.
Use this Pan icon to click and drag the
graph to view a specific area.
Use this Zoom In icon to view the graph in
more detail.
StruxureWare Central 6.3.0
122