
User Manual
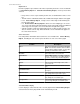
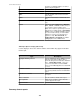

• Only a summary report includes the following information:
Column Description
Minimum Value
The lowest value recorded during the
time-frame of the report.
Maximum Value
The highest value recorded during the
time-frame of the report.
Average Value
The average of the values recorded
during the time-frame of the report.
Last Known Value
The most recent value recorded before
the end of the time-frame of the report.
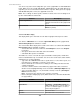
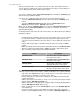
Table-format reports
This report format provides sensor data, in the form of table that lists all device sensors
included in a report.
You create a table-format Sensor History Report by selecting the Table report format in
the "Report Criteria" display.
You can access a table-format report view of a previously generated report:
•
Select the Edit Report Criteria icon in the report view, and the Table report format.
•
Select the Edit Report Criteria right-click option in Saved Reports in the
Reports perspective, and the Table report format.
Note: You can click the Table Data icon or select the Open Table Data option in a graph-
format Sensor History Report to view data as a table. See "Sensor Table Data" display.
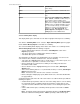
The number of sensors covered in the report, total number of data points, and the time
frame are identified at the top of each table. You can use the search feature, table columns,
and button icons, to do the following:
•
Type text in the Search field to locate a specific device or sensor in the report, or to
narrow the list to a particular set of device sensor entries.
• Click a column title to sort the list in ascending or descending order based on that
column's information.
• Edit the date range, report format, or sensors for a selected report using the "Report
Criteria" display ( Edit Report Criteria icon).
• Edit the report name or export properties using the "Name and Schedule Data Export"
display ( Edit Report Criteria option or icon).
•
Name a report and save it in the Saved Reports section of the Available Reports
view ( Save icon).
• Select the columns, and the order in which they appear in the table, and choose
whether or not to highlight alarming sensors in the table ( Edit Report Options icon).
•
Save sensor table data as a *.csv (the default selection) or *.txt file ( Save Report
Data and chevron icons).
Note: You must use the chevron icon to select the *.txt format.
•
Browse through a multiple-page report ( Go to arrow icons, and a box that identifies
the page number).
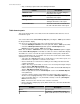
Column Description
Device
The device label.
Parent Device <hostname> (StruxureWare Central) for
SNMP and Modbus devices, or the IP address or
StruxureWare Central 6.3.0
118