
User's Manual
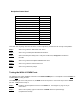
Table Of Contents

Spectrum Plot
Step 1.
When at the # prompt, type the command: start.
Step 2.
When at the # prompt, type the command: ./stop_reboot.
Step 3
. When at the # prompt type the command: menu. This will be the main menu.
Step 4
. Select 1 Collect signal Info. This brings up the collect menu.
At this point data needs to be entered in certain fields, so the system can make data collects.
Step 5.
Select 4 to enter the face of the antenna array. This will test all three faces receiving
different frequencies.
Step 6.
Select an antenna face 1-4.
Step 7.
Select 14 to enter protocol.
Step 8.
Select 5 to enter wide protocol.
The computing device must now be readied to reveal the spectrum plot:
Step 9.
On the desktop select the icon spect. This will launch the spectrum plot application.
Step 10
. When the graphic comes up, there will appear a rectangular box. The box at the upper left
requires the IP address of the unit under test. Enter the IP address for the unit
under test.
Step 11.
After the IP address is entered, select the connect button next to the address box.
The green LED next to the connect button will blink green when connection is made.
Step 12.
Select 10 in the collect menu on the QvtTerm terminal. This is the command that
performs the collect.
Step 13.
Click on the Frequency Domain window.
Step 14.
Select A to autoscale. Look for cellular activity. The autoscale feature works only on
Windows 2000 and Windows NT.
The autoscale feature allows the plots to show the center frequency, and the associated time domain selected so
that the data can be analyzed. The frequency domain will display 2 channels, channel 0 = red, and channel 1 =
blue. If either of the channels flat line, suspect problems at the cable level.
If the data reads anything other than the above, contact engineering to determine the severity of the problem.
Testing The GPS
Step 1.
When at the # prompt, type the command: start. This starts the WLS software.
Step 2.
When at the # prompt, type the command: ./stop_reboot.