
Datasheet


ADXL326
Rev. 0 | Page 6 of 16
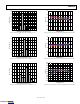
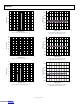
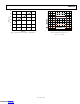
TYPICAL PERFORMANCE CHARACTERISTICS
N > 1000 for all typical performance plots, unless otherwise noted.
1.46 1.47 1.48 1.49 1.51 1.52 1.53 1.54
OUTPUT (V)
POPUL
A
TION (%)
0
10
20
30
40
50
60
70
80
90
1.50
07948-005
Figure 3. X-Axis Zero g Bias at 25°C, V
S
= 3 V
POPUL
A
TION (%)
0
10
20
30
40
50
60
70
80
90
100
1.46 1.47 1.48 1.49 1.50 1.51 1.52 1.53 1.54
OUTPUT (V)
0
7948-006
Figure 4. Y-Axis Zero g Bias at 25°C, V
S
= 3 V
POPUL
A
TION (%)
0
10
20
30
40
50
60
70
80
1.46 1.47 1.48 1.49 1.50 1.51 1.52 1.53 1.54
OUTPUT (V)
07948-007
Figure 5. Z-Axis Zero g Bias at 25°C, V
S
= 3 V
POPUL
A
TION (%)
0
10
20
30
40
–62 –60 –58 –56 –54 –52 –50
VOLTAGE (mV)
07948-008
Figure 6. X-Axis Self Test Response at 25°C, V
S
= 3 V
POPUL
A
TION (%)
VOLTAGE (mV)
0
10
20
30
40
52 54 56 58 60 62 64 66
07948-009
Figure 7. Y-Axis Self Test Response at 25°C, V
S
= 3 V
POPUL
A
TION (%)
VOLTAGE (mV)
0
10
20
30
90 92 94 96 98 100 102 104
07948-010
Figure 8. Z-Axis Self Test Response at 25°C, V
S
= 3 V
Downloaded from Arrow.com.Downloaded from Arrow.com.Downloaded from Arrow.com.Downloaded from Arrow.com.Downloaded from Arrow.com.Downloaded from Arrow.com.