
Datasheet


AD9549
Rev. D | Page 38 of 76
The measurement error (ε) associated with the frequency
estimator depends on the choice of the measurement interval
parameter (K). These are related by
( )
1
1floor
−
−
=
ρK
ρK
ε
With a specified fractional error (ε
0
), only those values of K
for which ε ≤ ε
0
results in a frequency estimate that meets the
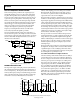
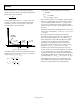
requirements. A plot of ε vs. K (for a given ρ) takes on the
general form that is shown in Figure 48.
ε
BOUNDED
BY ENVELOPE
ε
ε
0
0
1
1
2
16
ε
<
ε
0
FOR
SOME K
(K
0
< K < K
1
)
ε
>
ε
0
FOR
ALL K < K
0
ε
<
ε
0
FOR
ALL K > K
1
K
LO
K
0
K
HI
K
1
K
06744-048
Figure 48. Frequency Estimator ε vs. K
An iterative technique is necessary to determine the exact values
of K
0
and K
1
. However, a closed form exists for a conservative
estimate of K
0
(K
LOW
) and K
1
(K
HIGH
).
+=
0
LOW
ερ
K
1
1
1
ceil
+=
0
HIGH
ερ
K
1
1
2
ceil
As an example, consider the following system conditions:
f
S
= 400 MHz
R = 8
f
REF_IN
= 155.52 MHz
ε
0
= 0.00005 (that is, 50 ppm)
These conditions yield K
MAX
= 3185, which is the largest K value
that can be programmed without causing the frequency estimator
counter to overflow. With K = K
MAX
, T
meas
= 163.84 μs, and ε =
30.2 ppm, K
MAX
generally (but not always) yields the smallest
value of ε, but this comes at the cost of the largest measurement
time (T
meas
).
If the measurement time must be reduced, then K
HIGH
can be used
instead of K
MAX
. This yields K
HIGH
= 1945, T
meas
= 100.05 μs, and
ε = 39.4 ppm.
The measurement time can be further reduced (though
marginally) by using K
1
instead of K
HIGH
. K
1
is found by solving
the ε ≤ ε
0
inequality iteratively. To do so, start with K = K
HIGH
and decrement K successively while evaluating the inequality
for each value of K. Stop the process the first time that the
inequality is no longer satisfied and add 1 to the value of K
thus obtained. The result is the value of K
1
. For the preceding
example, K
1
= 1912, T
meas
= 98.35 μs, and ε = 39.8 ppm.
If a further reduction of the measurement time is necessary,
K
0
can be used. K
0
is found in a manner similar to K
1
. Start with
K = K
LOW
and increment K successively while evaluating the
inequality for each value of K. Stop the process the first time that
the inequality is satisfied. The result is the value of K
0
. For the
preceding example, K
0
= 1005, T
meas
= 51.70 μs, and ε = 49.0 ppm.
If external frequency division exists between the DAC output
and the FDBK_IN pins, the frequency estimator should not be
used because it will calculate the wrong initial frequency.